Scatterplot Matrix
If we want to show the relationships between
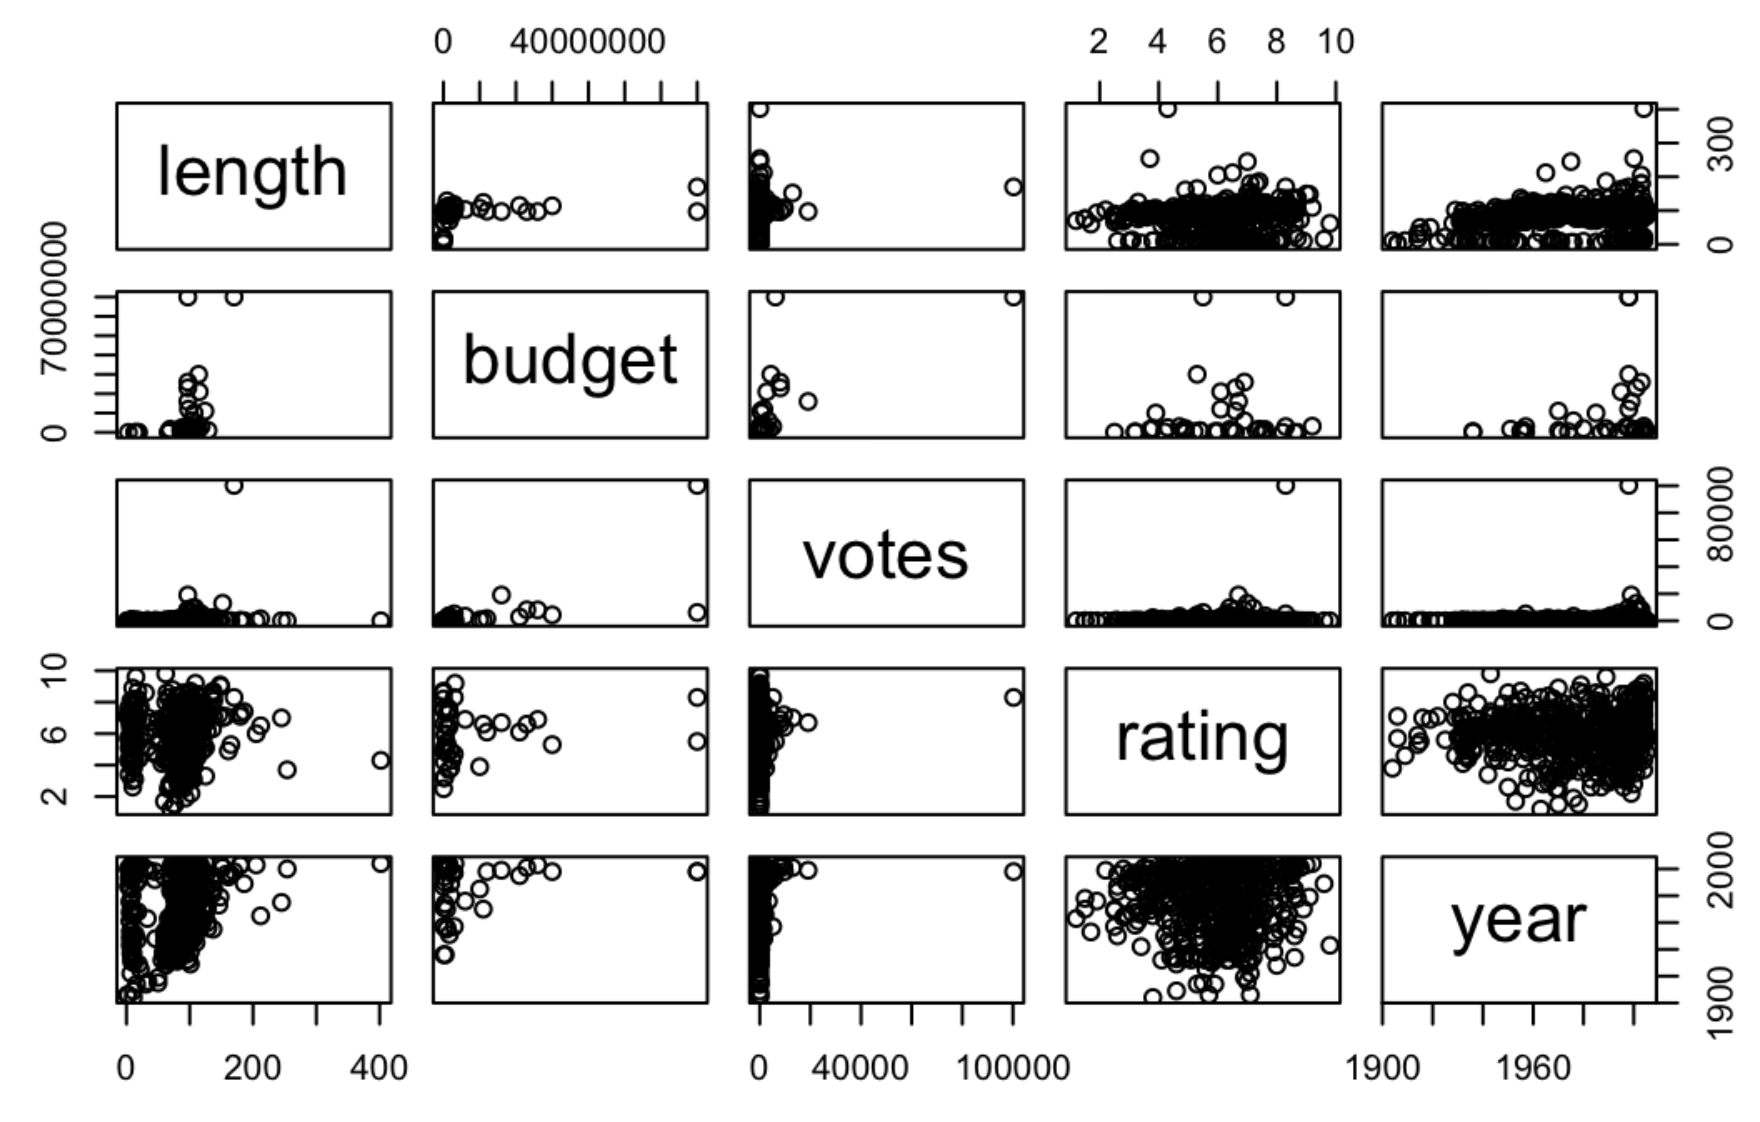
- When passing multiple variables to the R built-in function
plot, it will create a scatterplot matrix. - While this is quite useful for personal exploration of a dataset, it is not recommended for presentation purposes. Something called the Hermann grid illusion makes this plot very difficult to examine.
Other implementations
ggpairs()inGGallysplom()inlattice
 by zcysxy