Density Curve
In Probability Theory, a density curve is a function that describes how a random variable is distributed. It is a smooth curve that shows how often each value of the random variable occurs.
In EDAV, a density curve for some data is the density curve of any distribution that approximates the data empirical distribution.
A common technique is to give each point a Normal Distribution with mean equal to its value. Then the density curve is the composition of multiple normal distributions.
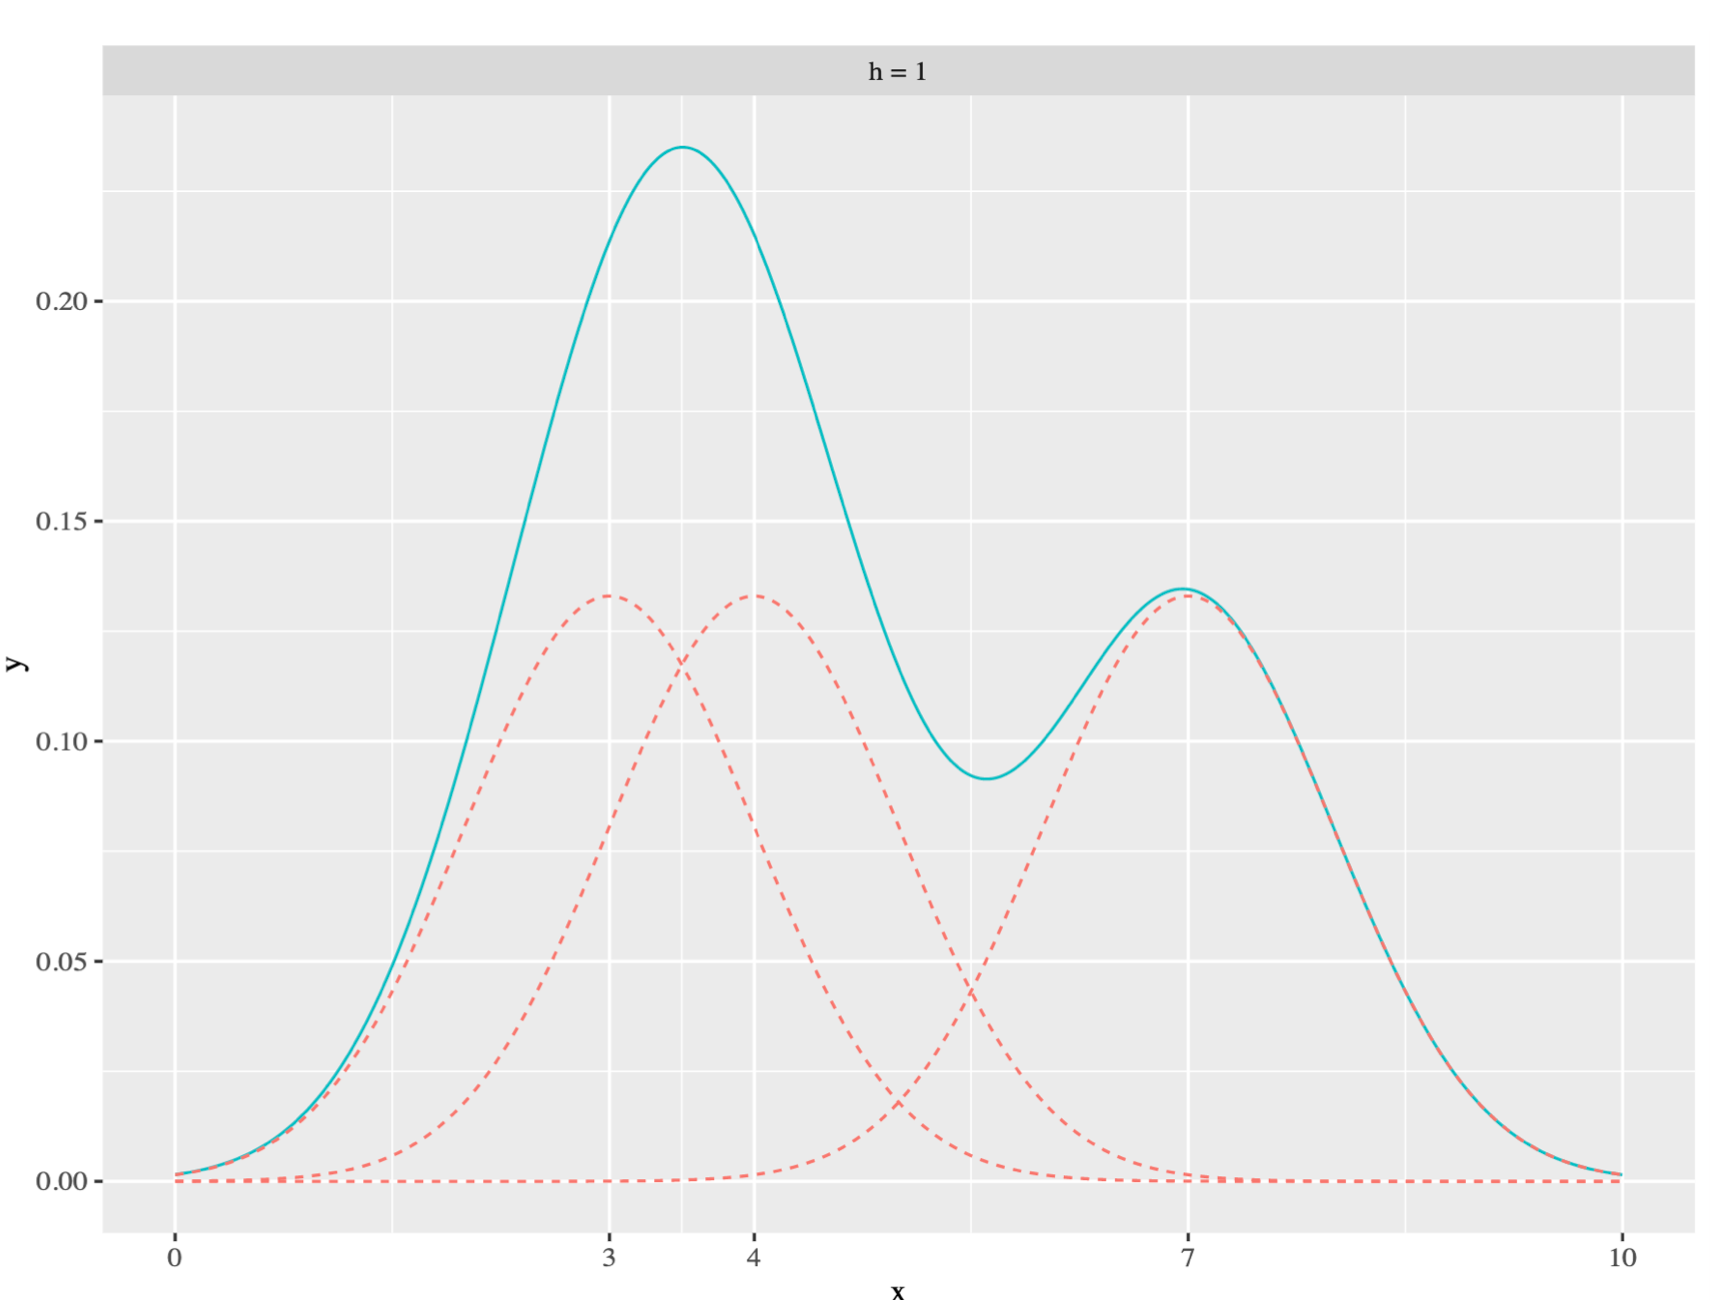
Then the variance of the normal distribution, which can be seen as binwidth in Histogram, controls the shape of the curve.
- If the variance is too small, then the Normal Distribution becomes a Dirac Distribution, and the composite density curve becomes too sharp
- If the variance is too large, then the Normal Distribution becomes a constant, and the composite density curve becomes too flat
In real implementations, such variance is controlled by parameter bandwidth h.
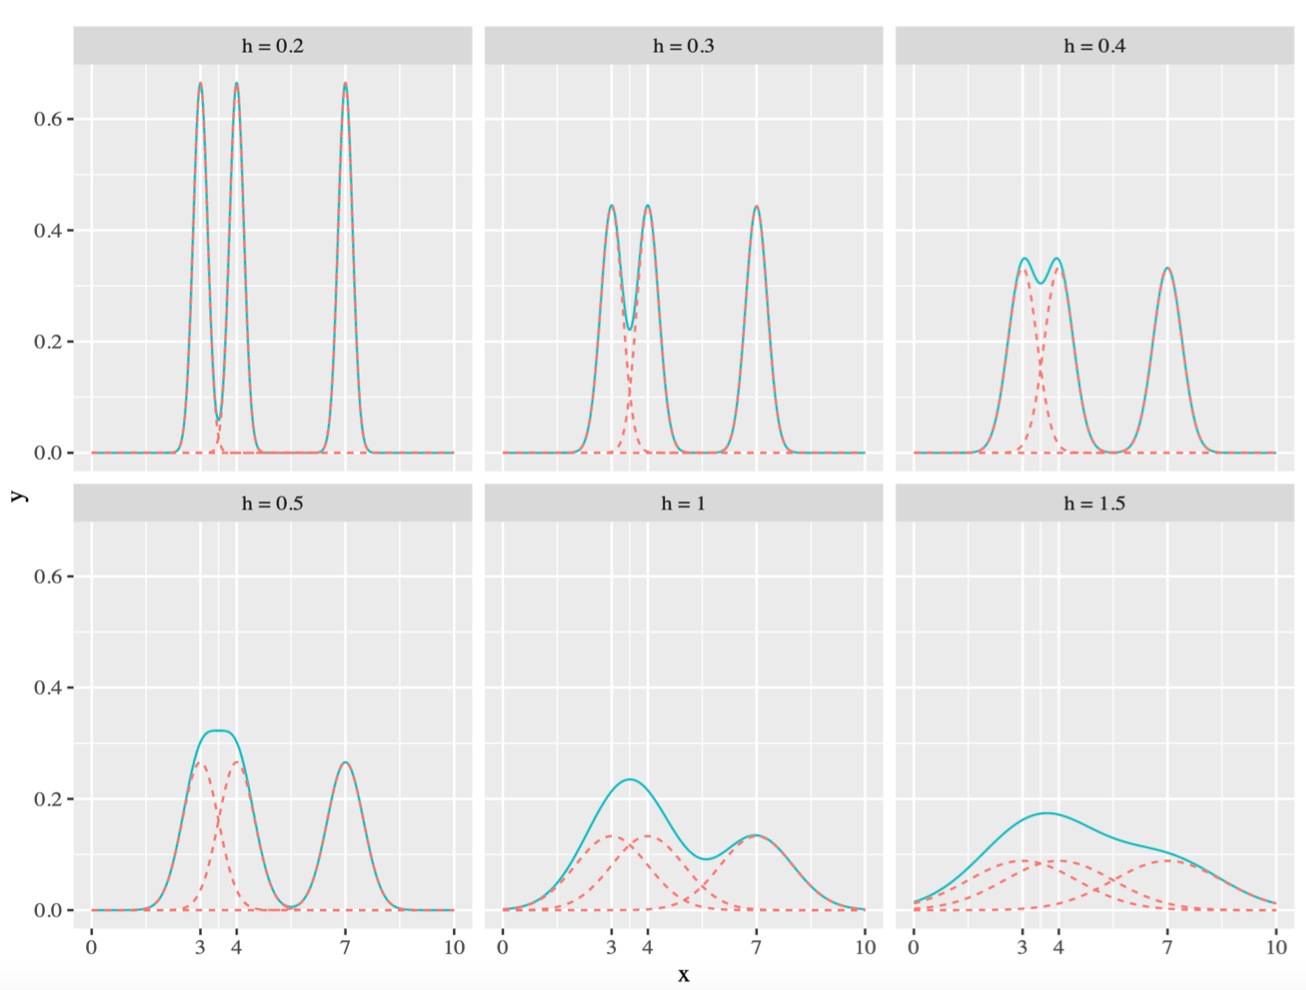
Sometimes due to the x-axis limits, the density curve doesn't go to zero at two ends (see the last graph above). We can expand the x-axis limits in such cases.
 by zcysxy