D3 Scale
Cartesian coordinates are different from the coordinates in an SVG.
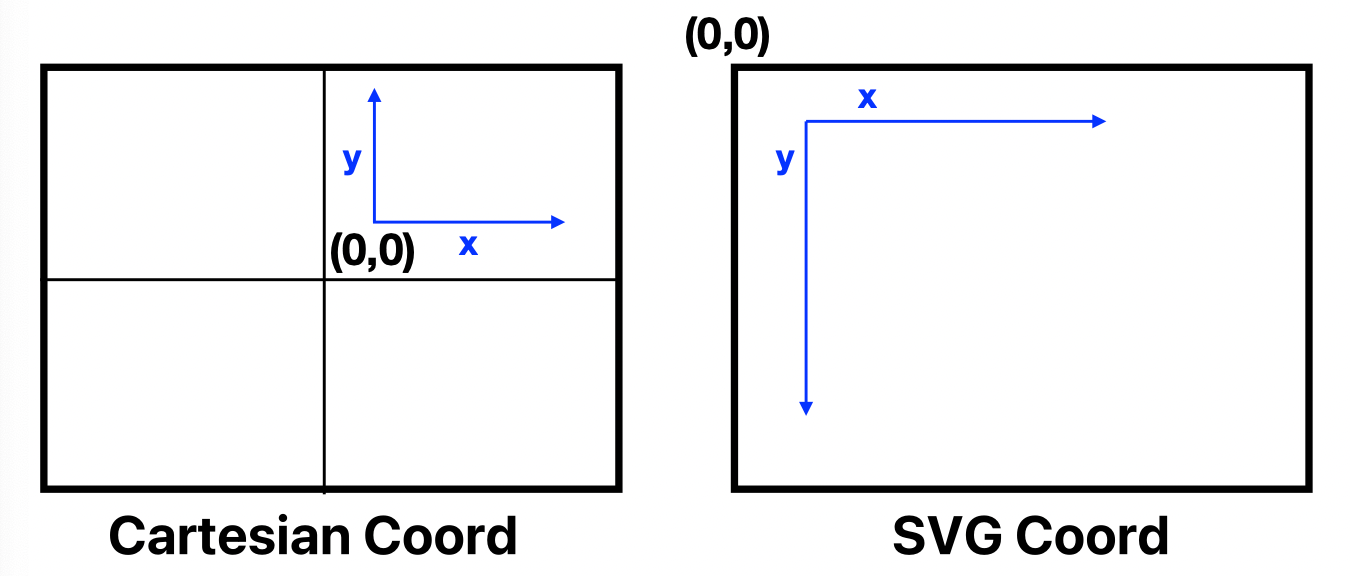
So we need transformers to map Cartesian coordinates to SVG coordinates; scales in D3 are such transformers.
There are two functions in D3 to create scales: one for Categorical Data—.scaleBand(), and one for Continuous Data—.scaleLinear().
Note that these functions are for creating your own scales rather than alternating the current scales.
Ordinal Scales
To create an ordinal scale:
const ordScale = d3.scaleBand()
    .domain(["cold", "warm", "hotel"])
    .range([0,600])
.scaleBand() evenly divide the range for each category.
ordScale.bandwidth() returns the bandwidth of the result.
And ordScale(category) returns the left boundary of the category band.
.domain() also accepts indexes of categories.
In this case, to make the above snippet more flexible, we can use .domain(d3.range(dataset.length)) instead of .domain([0,1,2,3,4]).
To have some padding between bands, use .paddingInner([paddingPercent1,...]); then the padding will be .bandwidth() * paddingPercent1.
It won't add padding before the first band or after the last band.
Continuous Scale
To create a continuous scale:
const yScale = d3.scaleLinear()
    .domain([-100,100])
    .range([0,500])
Then yScale(-100) == 0, yScale(0) == 250, yScale(50) == 375, yScale(100) == 500.
A more flexible pattern would be
const yScale = d3.scaleLinear()
    .domain([0,d3.max(data)])
    .range([svgHeight,0])
Then to create a vertical bar, we can set
rect.attr('y', d => yScale(d))rect.attr('height', d => svgHeight - yScale(d))
An Example
// Set the size of the svg
const w = 400;
const h = 300;
// Create the svg
const svg = d3.select("body")
.append("svg")
.attr("width", w)
.attr("height", h)
// Bar height
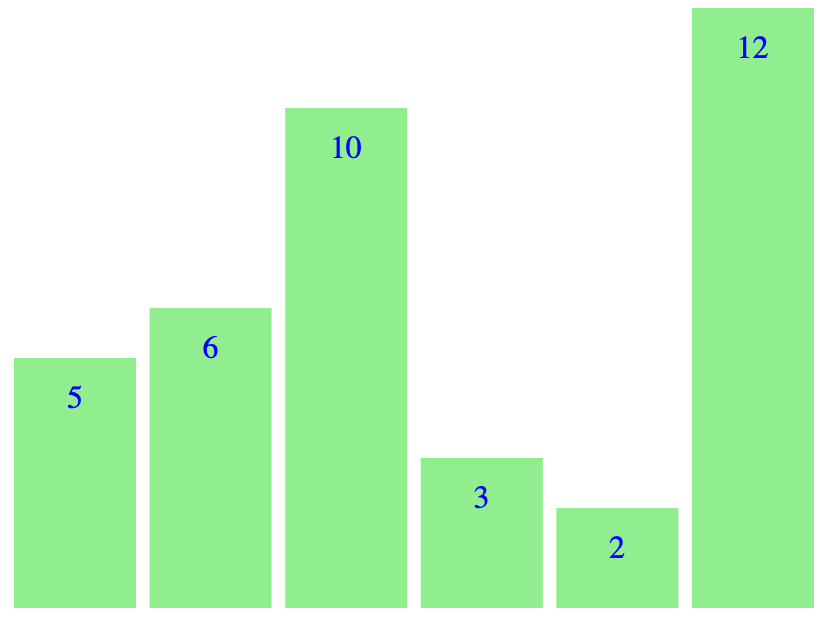
const bardata = [5, 6, 10, 3, 2, 12];
// Ordinal x scale
const xScale = d3.scaleBand()
.domain(d3.range(bardata.length))
.range([0, w])
.paddingInner(.1);
// Continuous y scale
const yScale = d3.scaleLinear()
.domain([0, d3.max(bardata)])
.range([h, 0])
// Create bars
const bars = svg.selectAll("rect")
.data(bardata);
bars.enter().append("rect")
.attr("x", (d, i) => xScale(i))
.attr("width", xScale.bandwidth())
.attr("y", d => yScale(d))
.attr("height", d => h - yScale(d))
.attr("fill", "lightgreen");
// Add text
svg.selectAll("text")
.data(bardata)
.enter()
.append("text")
.attr("x", (d, i) => xScale(i) + .5*xScale.bandwidth())
.attr("y", d => yScale(d) + 25)
.text(d => d)
.attr("fill", "blue")
.attr("text-anchor", "middle");
The result:
 by zcysxy