Heatmap
How does a heatmap work:
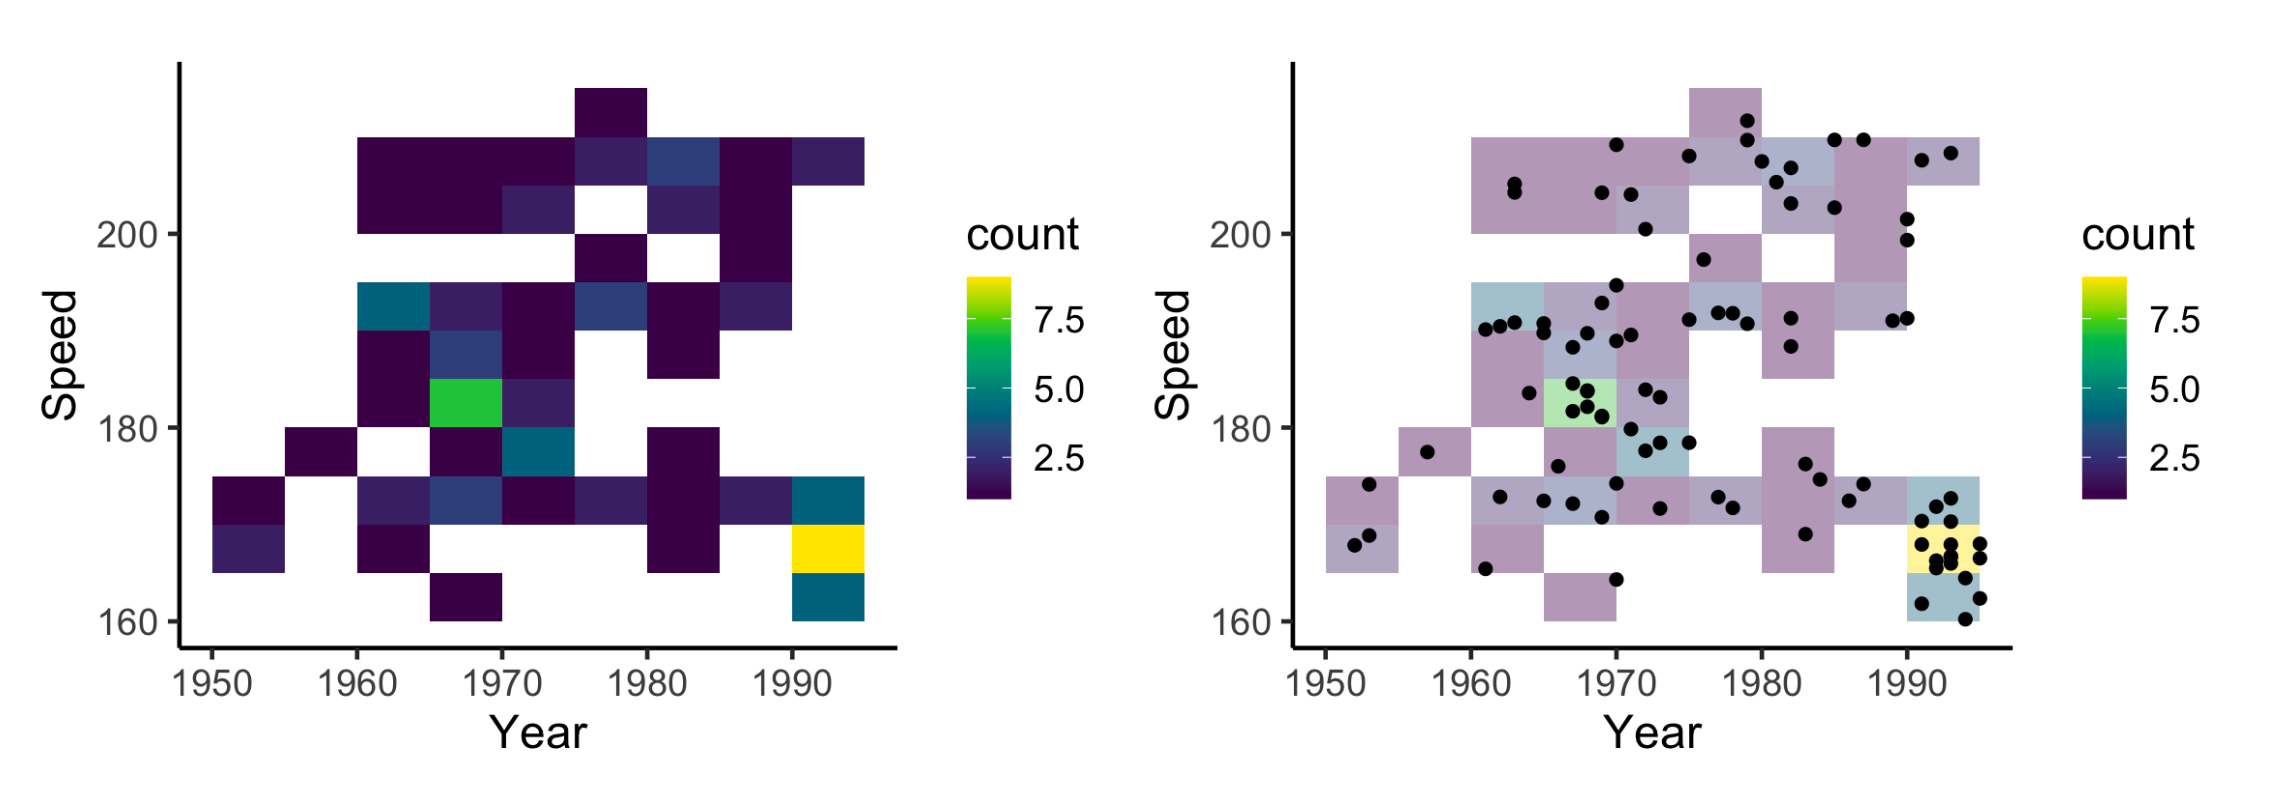
Heatmaps can be seen as two-dimensional Histograms. Therefore, bin width is also an important element for heatmaps.
In ggplot2, use geom_bin2d() to create a heatmap.
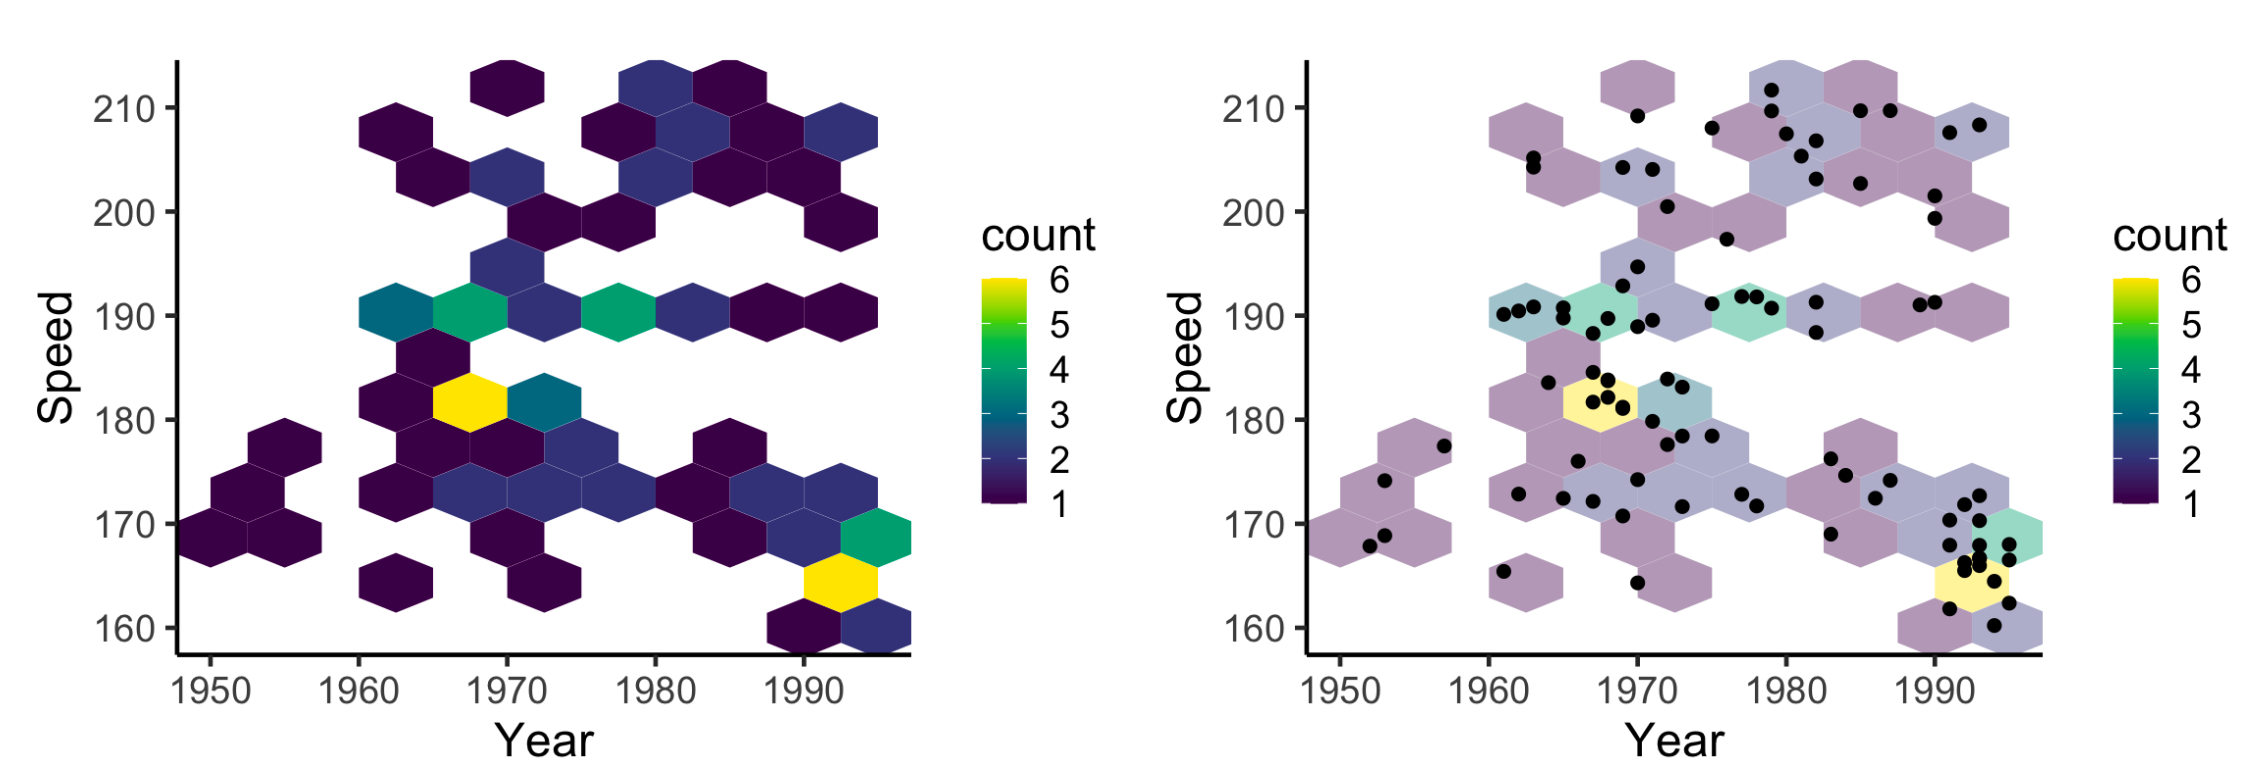
Hex Heatmap
Rather than using squares, hex heatmaps use hexagons. Hexagons are more compact, provide more accurate information, and make more natural transitions. In ggplot2, use geom_hex to create hex heatmaps.
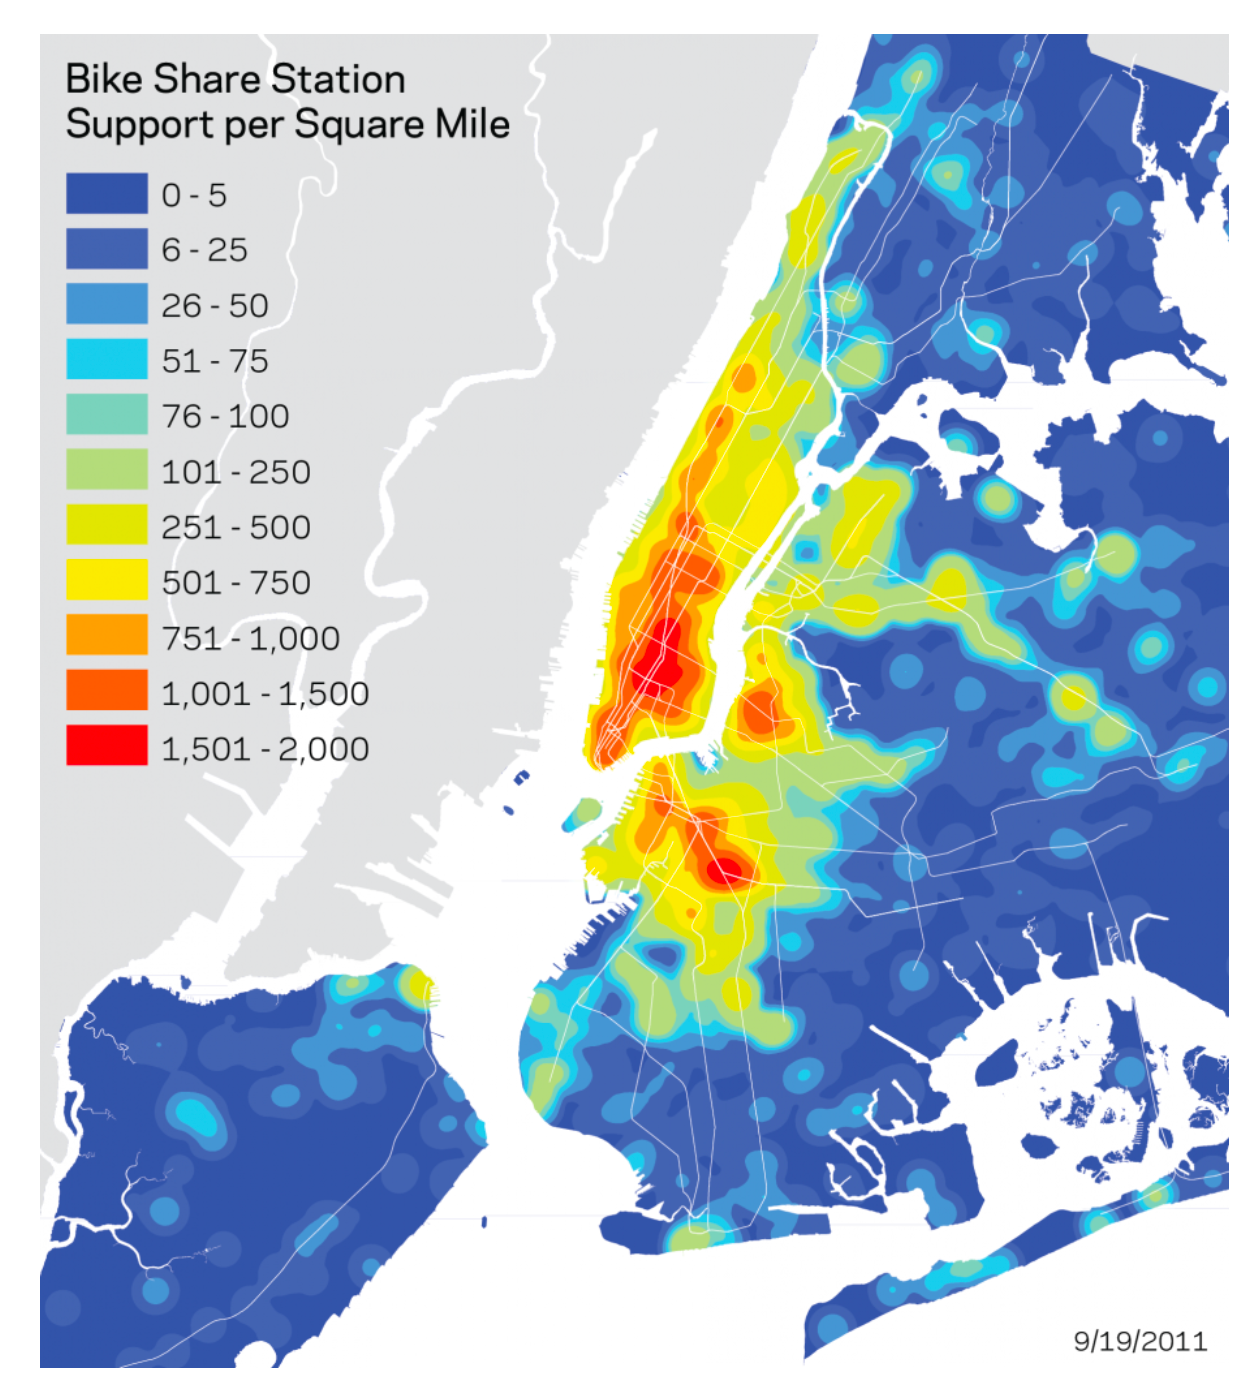
Unfixed Shapes
When using unfixed shapes, we can think of heatmaps as colored Density Contour Plots. This kind of heatmaps is widely used for geographic patterns and thermal patterns.
Changing Colors
Colors in heatmaps show the magnitudes of the phenomenon (cluster). An example to change the color: scale_fill_continuous(low = "grey", high = "purple")
Three Variables
The color can not only represent the magnitude of the cluster, but it can also represent a third variable. By doing this, heatmaps are no longer restricted to Continuous Variables, but can also be for categorical.
For three variables, we cannot use geom_bin2d anymore. Some choices in ggplot2 are
geom_tile: plots a dot as a tile, with specified width and height- use
color = whiteto add white borders to the tiles
- use
geom_rect: plots a dot as a rectangle, with specifiedxmin,xmax,ymin,ymax- Rectangles can be squares with
coord_fixed()
- Rectangles can be squares with
geom_raster: same asgeom_tilew/ uniform width and height, and is faster
The above functions only plot the tiles without colors. Use aes(fill = z) to fill the colors according to variable z.
 by zcysxy