Parallel Coordinate
Instead of making coordinates orthogonal, we can make them parallel to adapt more than 3 coordinates/variables. Just like line charts, parallel coordinate plots are for EDAV - Multivariate Continuous Data.
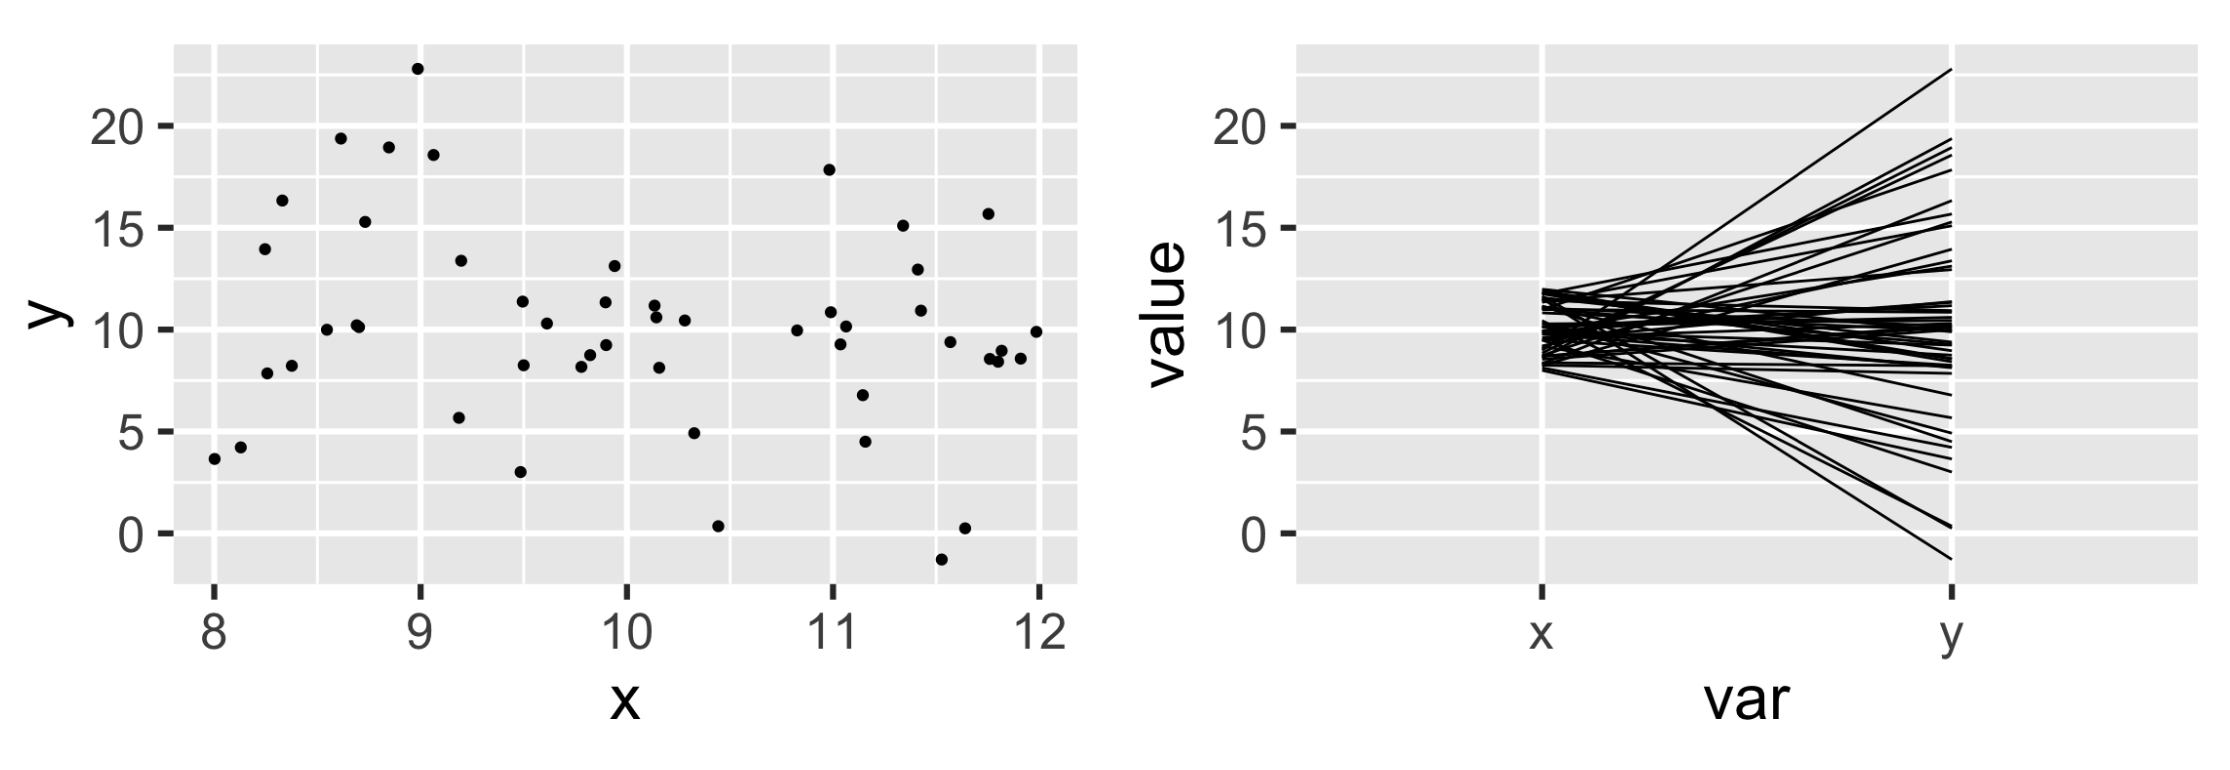
Slope Graph
When there are only two parallel coordinates, the graph is called a slope graph.
To make the patterns in a slope graph more obvious, we can apply some data transformation
- Standardization:
(x - mean(x)) / sd(x) - Rescaling (to
): scales::rescale()
A drawback of these transformations is that we lose the actual units. A remedy is to label the units on each axis.
More Variables
We can use ggparcoord in GGally to create parallel coordinate plots.
scale = "std"(standardization) is the default scalescale = "uniminmax"is rescalingscale = "globalminmax"is the scale without transformation
Other methods to reveal the patterns:
-
Reorder the variables
- Making lines cross may be better than making them parallel
-
Make lines transparent (change alpha)
-
Interpolation
- Instead of using straight lines, we can use splines or other interpolated curves
- This helps separate lines sharing the same value of some variables
-
Highlight a trend
- Use colors to separate the trend and other lines
Implementations
ggplot2::geom_line()- Use tidyr to transform variable names to x-axis first
GGally::ggparcoord()(static, ggplot2)MASS:: parcoord()(static, base)parcoords::parcoords()(interactive)devtools::install_github(“timelyportfolio/parcoords”)
 by zcysxy