Alluvial Diagram
Alluvial diagrams take inspiration from alluvial fans.
They use Parallel Coordinates for Multivariate Categorical Data.
They show how data move from one category to some other categories.
Alluvial diagrams work well for data with flows in it. Observations with the same movement are drawn together to show the flow.
Some examples of data types that are suitable for alluvial diagrams are
- Hierarchical data
- Temporal data
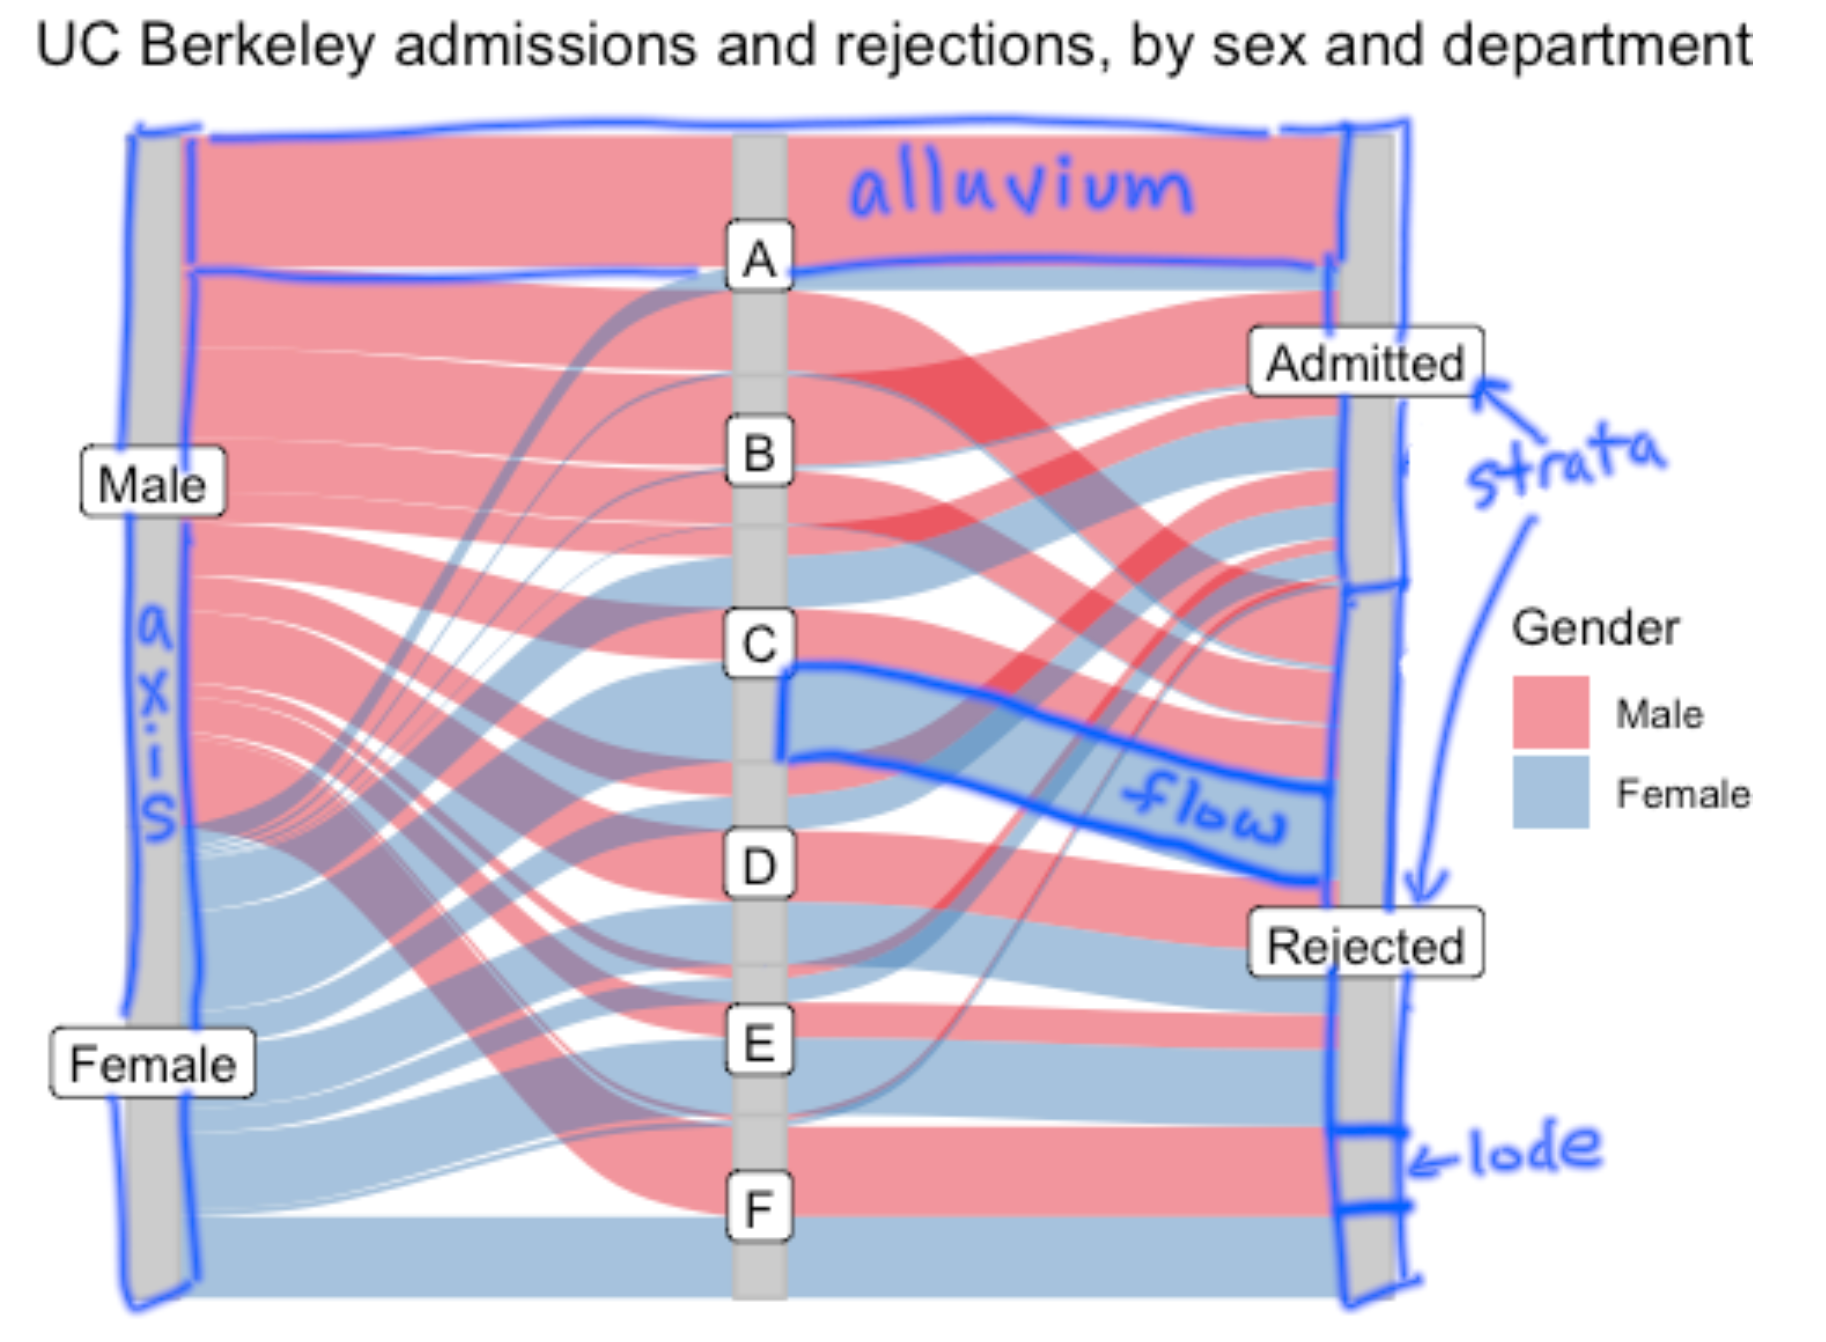
Other than axes, we can use colors for one variable to better visualize the patterns. The variable we choose to color should be our most interested one.
Different categories in axes are called strata. Without alluviums, these strata form a relative stacked Bar Chart.
The height of the strata and flows represent the size of the clusters.
Implementation
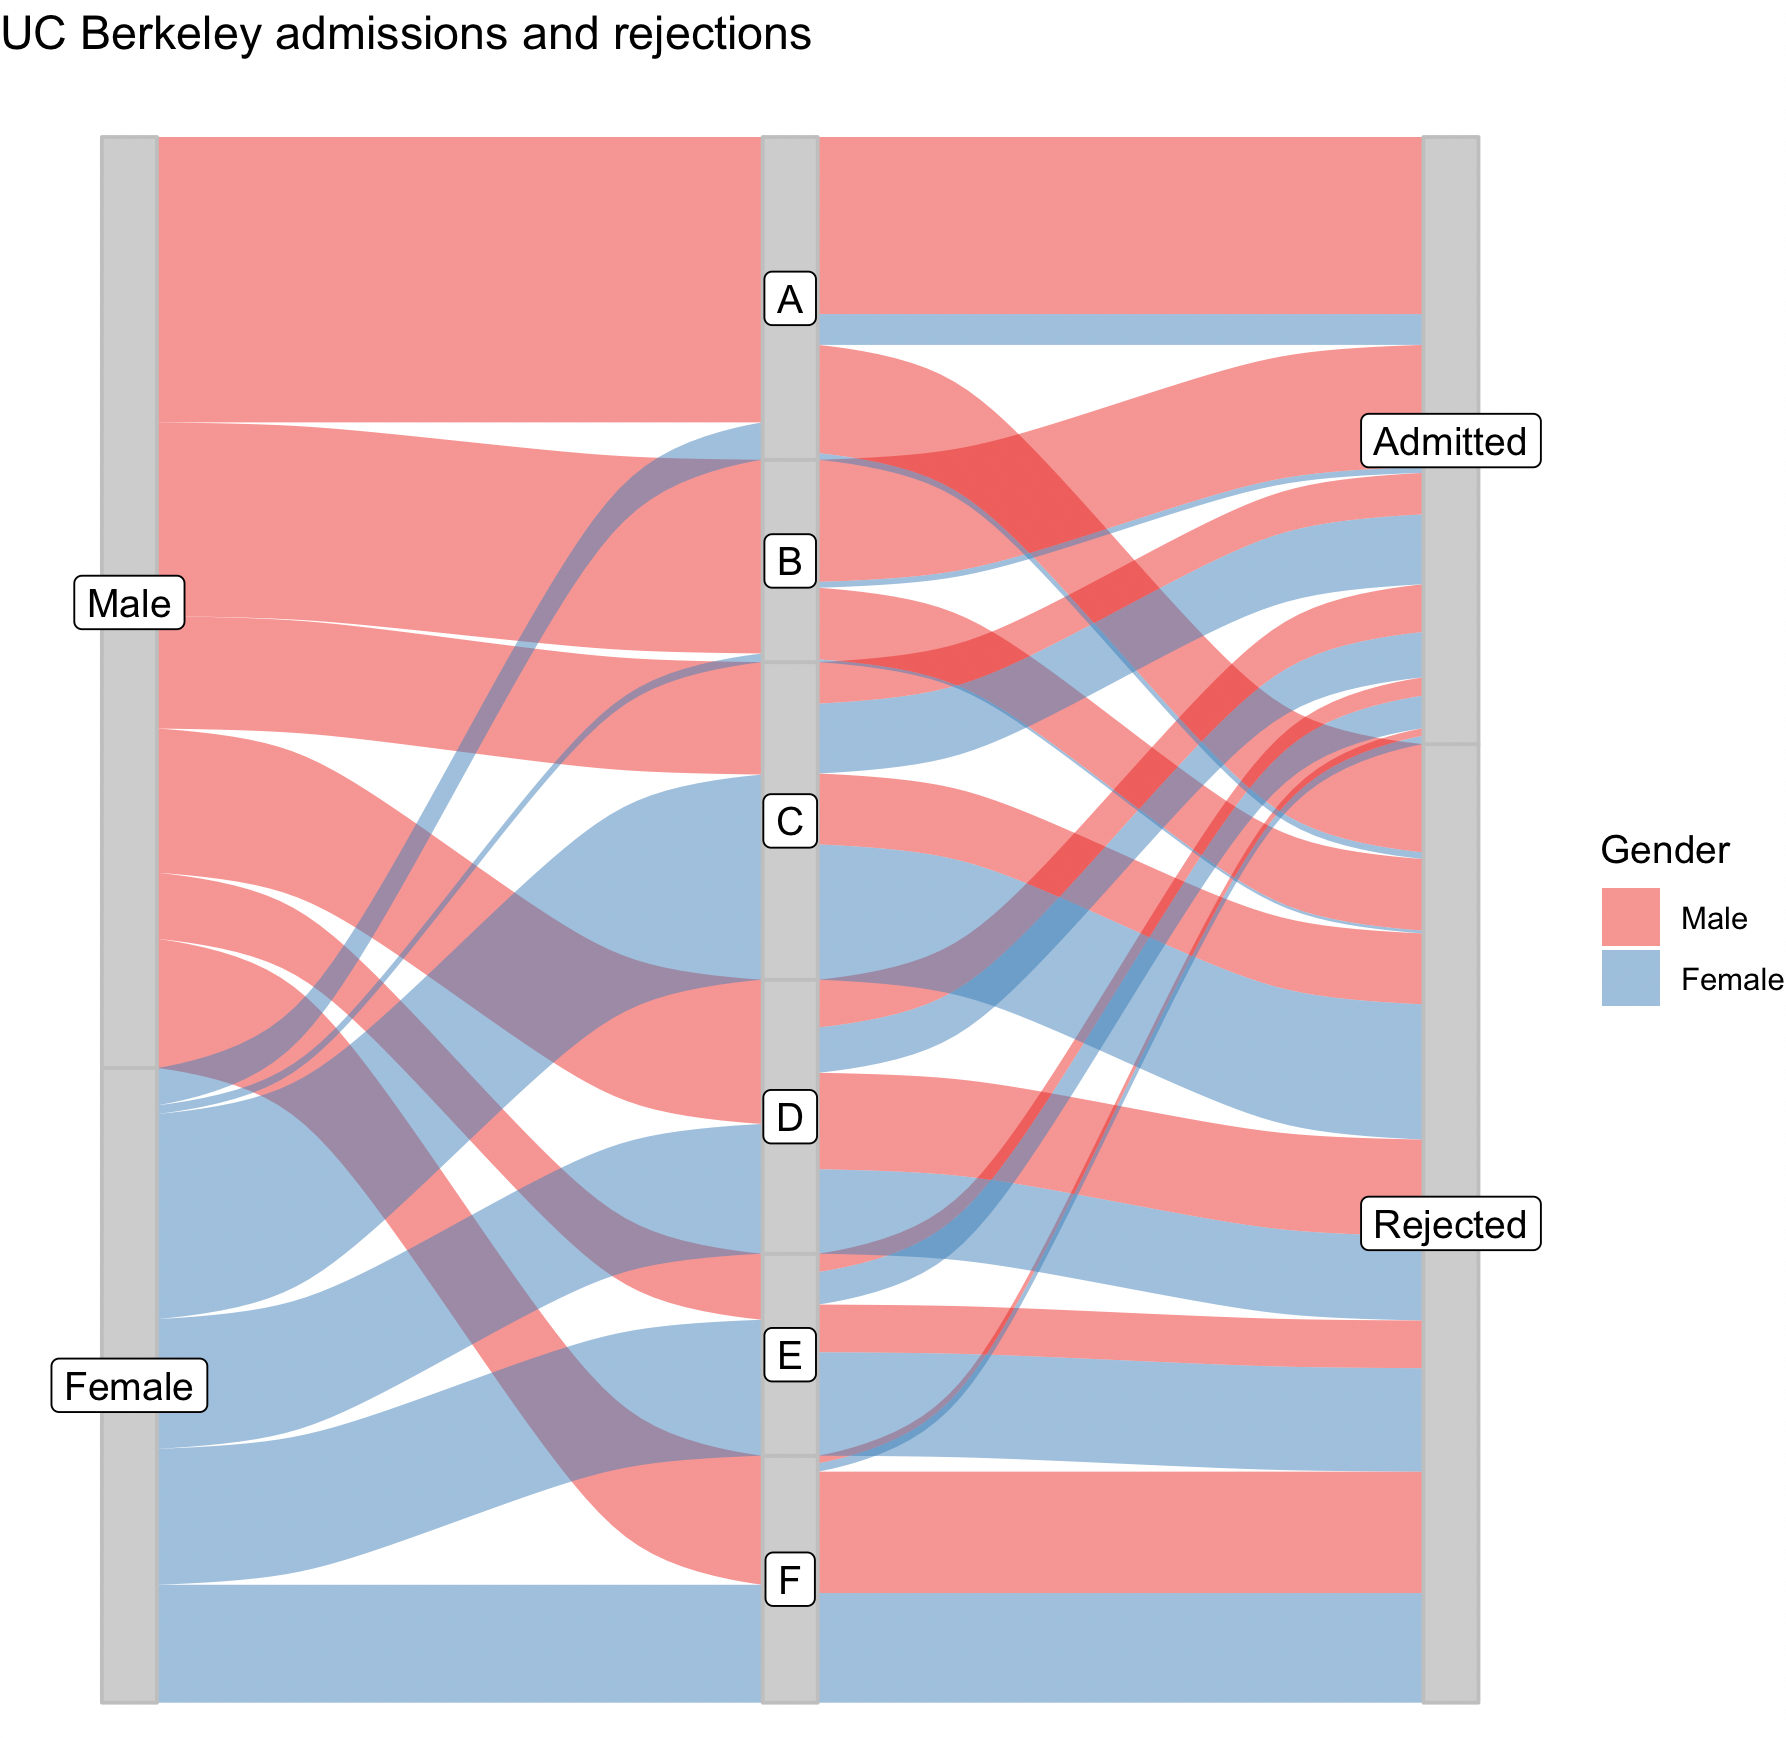
We can use geom_alluvium in package ggalluvial to draw alluvial diagrams.
library(ggalluvial)
g = ggplot(
    as.data.frame(UCBAdmissions),
    aes(y = Freq, axis1 = Gender, axis2 = Dept, axis3 = Admit)
) +
    geom_flow(aes(fill = Gender), width = 1/12) +
    geom_stratum(width = 1/12, fill = "grey80", color = "grey") +
    geom_label(
        stat = "stratum",
        aes(label = after_stat(stratum))
    ) +
    scale_x_discrete(expand = c(.05, .05)) +
    scale_fill_brewer(type = "qual", palette = "Set1") +
    ggtitle("UC Berkeley admissions and rejections") +
    theme_void()
plot(g)
An important feature of an alluvial diagram is the consistent flow, which means an observation is a continuous curve.
While we can use geom_flow to create similar diagrams, where flows may not be connected. Such diagrams are only useful if you only focus on the association between adjacent categorical variables.
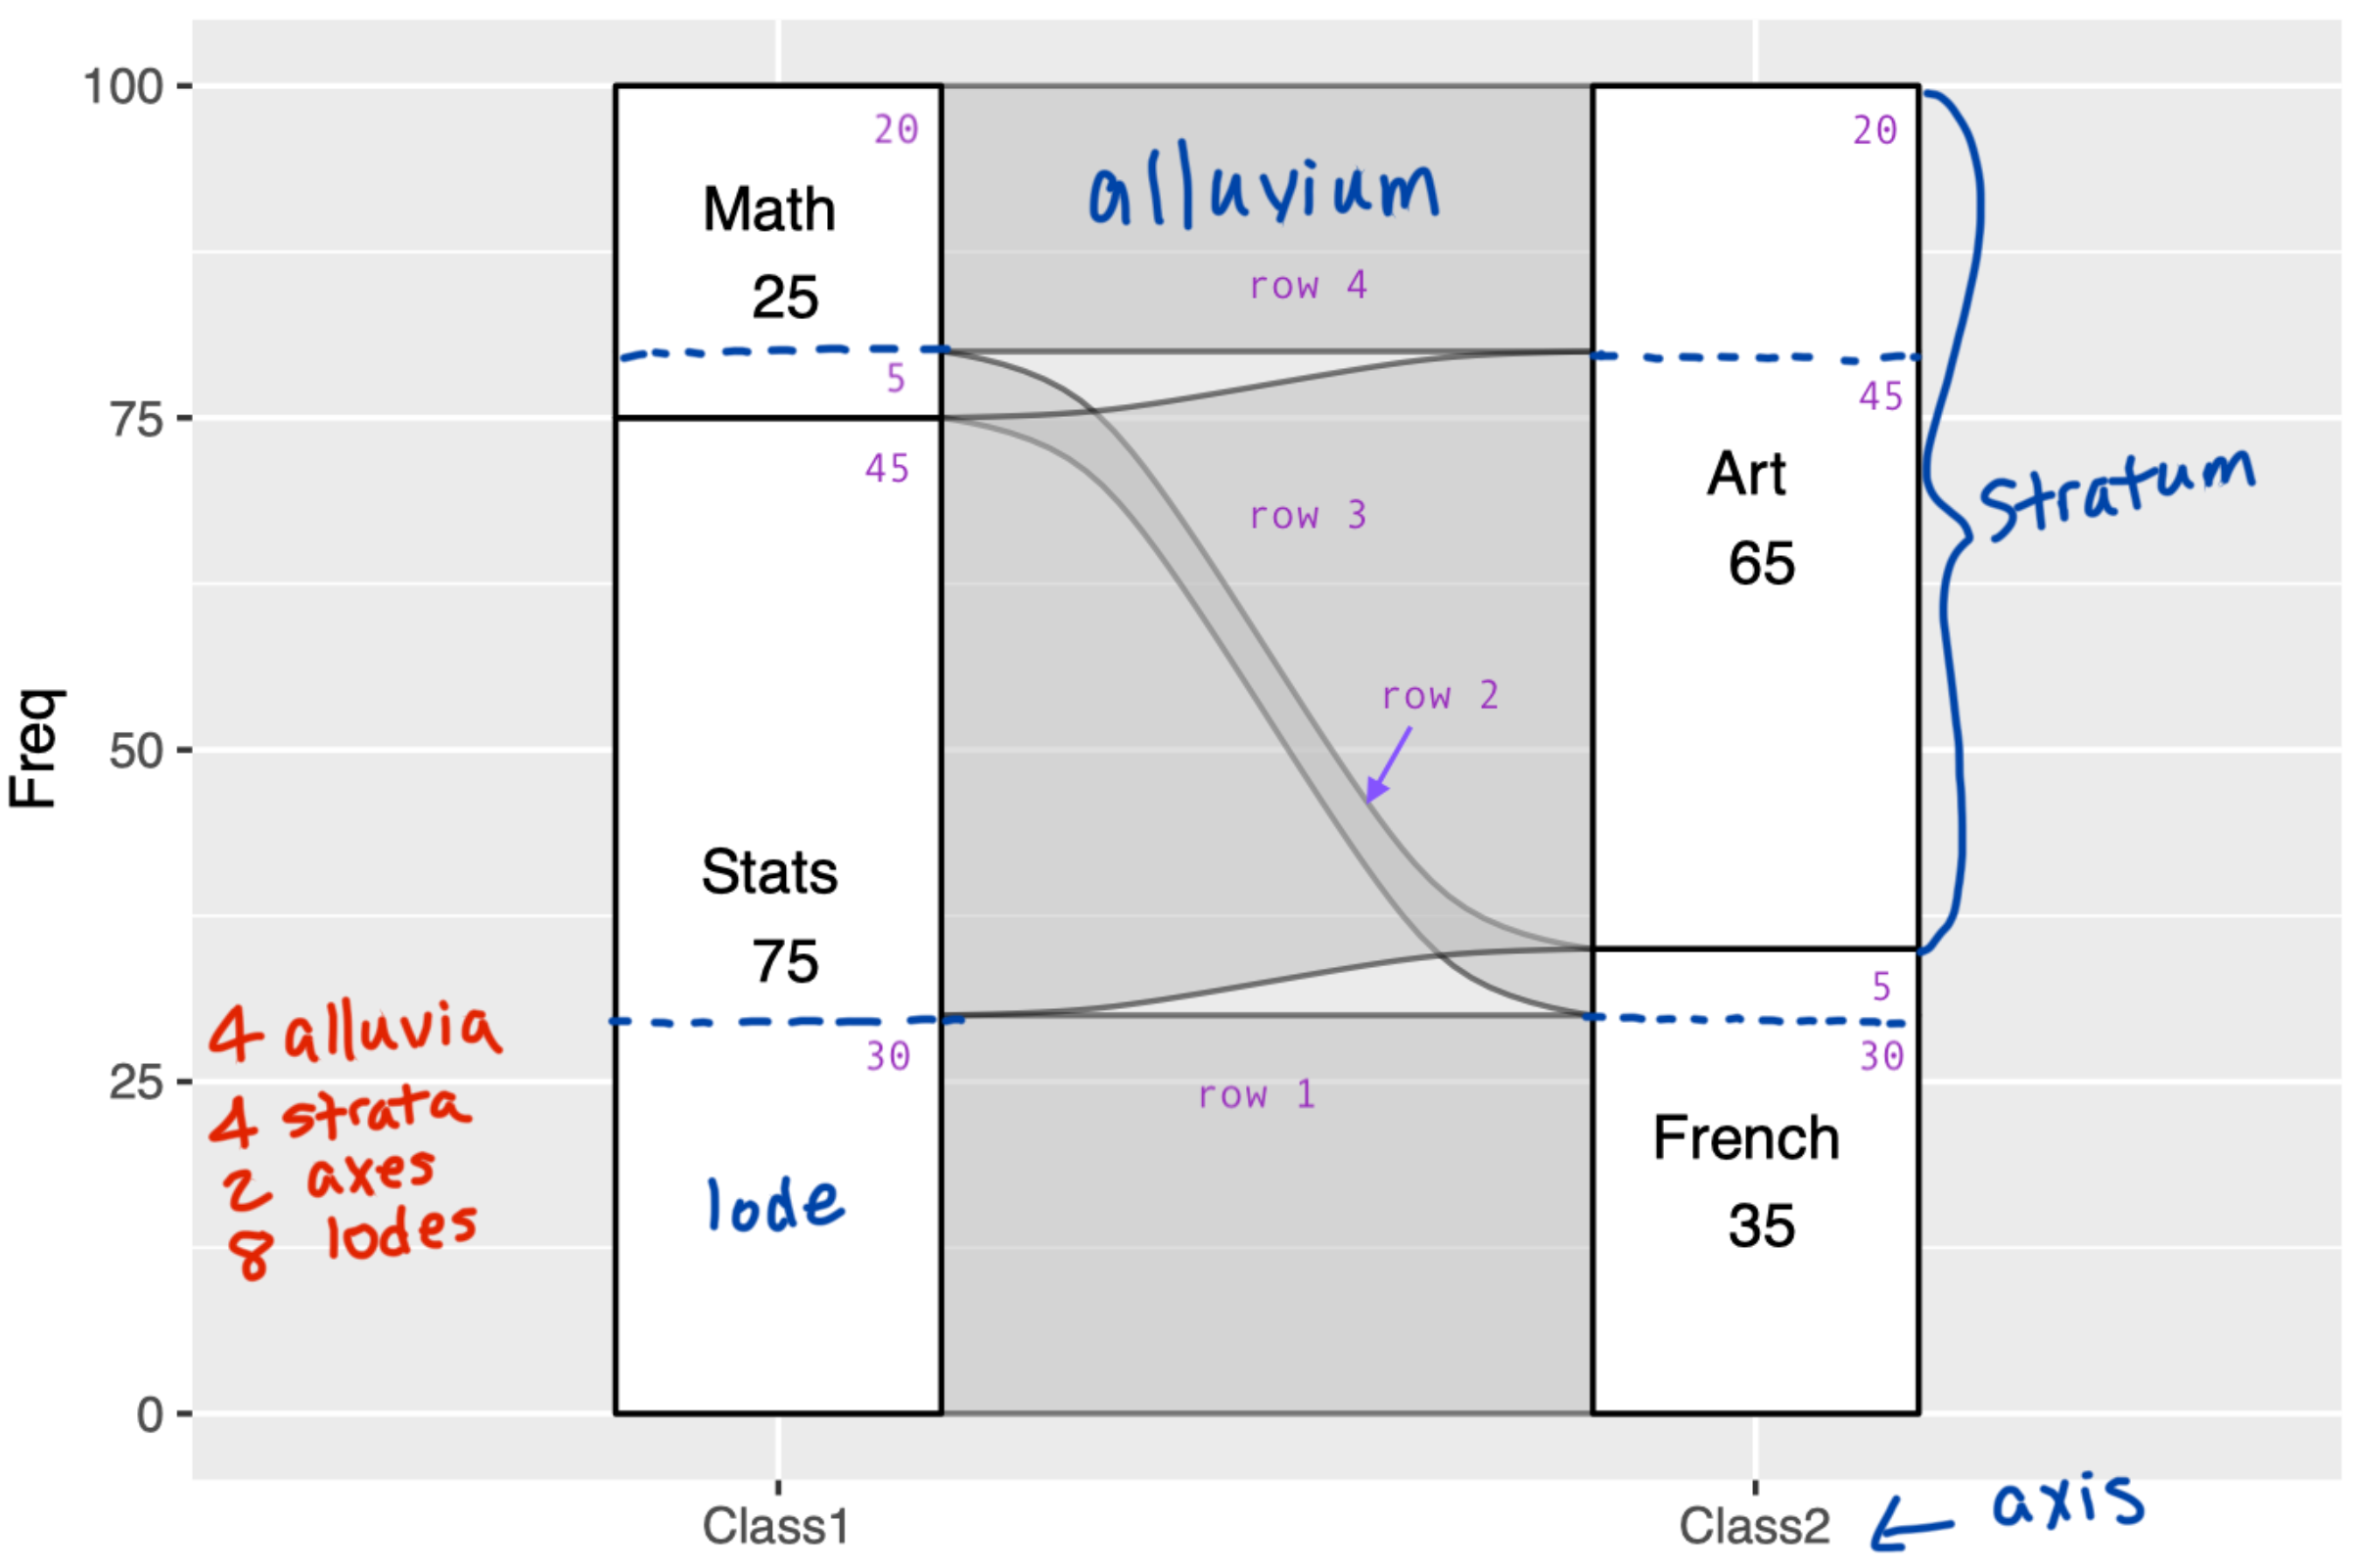
Lodes Form
- Able to present ghosted data, which doesn't have all categorical variables
- Need not specify the axes
To transform a dataframe to a lodes form, use to_lodes_form(df, axes = 1:2). It works like pivot_longer in tidyr, making one row per lode.
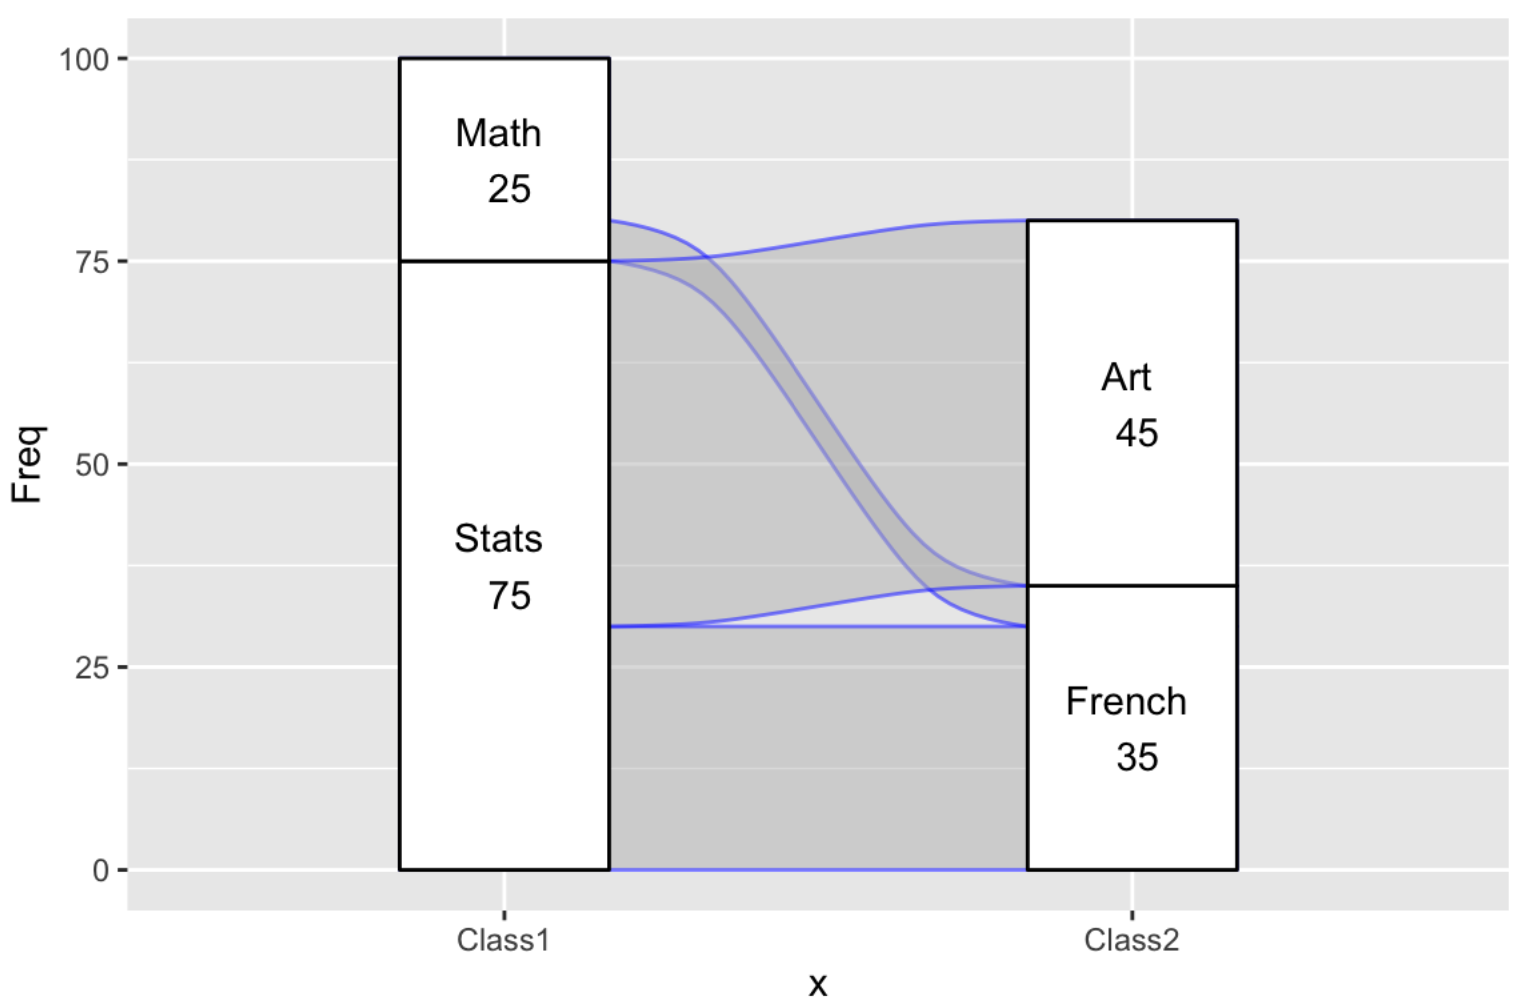
An example lodes form (corresponding to the graph below):
##   Freq alluvium      x stratum
## 1   30        1 Class1   Stats
## 2    5        2 Class1    Math
## 3   45        3 Class1   Stats
## 4   20        4 Class1    Math
## 5   30        1 Class2  French
## 6    5        2 Class2  French
## 7   45        3 Class2     Art
df %>%
    to_lodes_form(axes = 1:2) %>%
    ggplot(, aes(alluvium = alluvium, x = x, stratum = stratum, y = Freq)) +
        geom_alluvium(color = "blue") +
        geom_stratum() +
        geom_text(stat = "stratum", aes(label = paste(after_stat(stratum), "\n", after_stat(count))))
 by zcysxy