Ridgeline
A ridgeline plot is a way of visualizing multiple densities in a single plot. This plot type is useful for visualizing data that has many different levels of density, such as data that has been binned. Ridgeline plots are similar to area charts, but they emphasize the shape of the data more than the area.
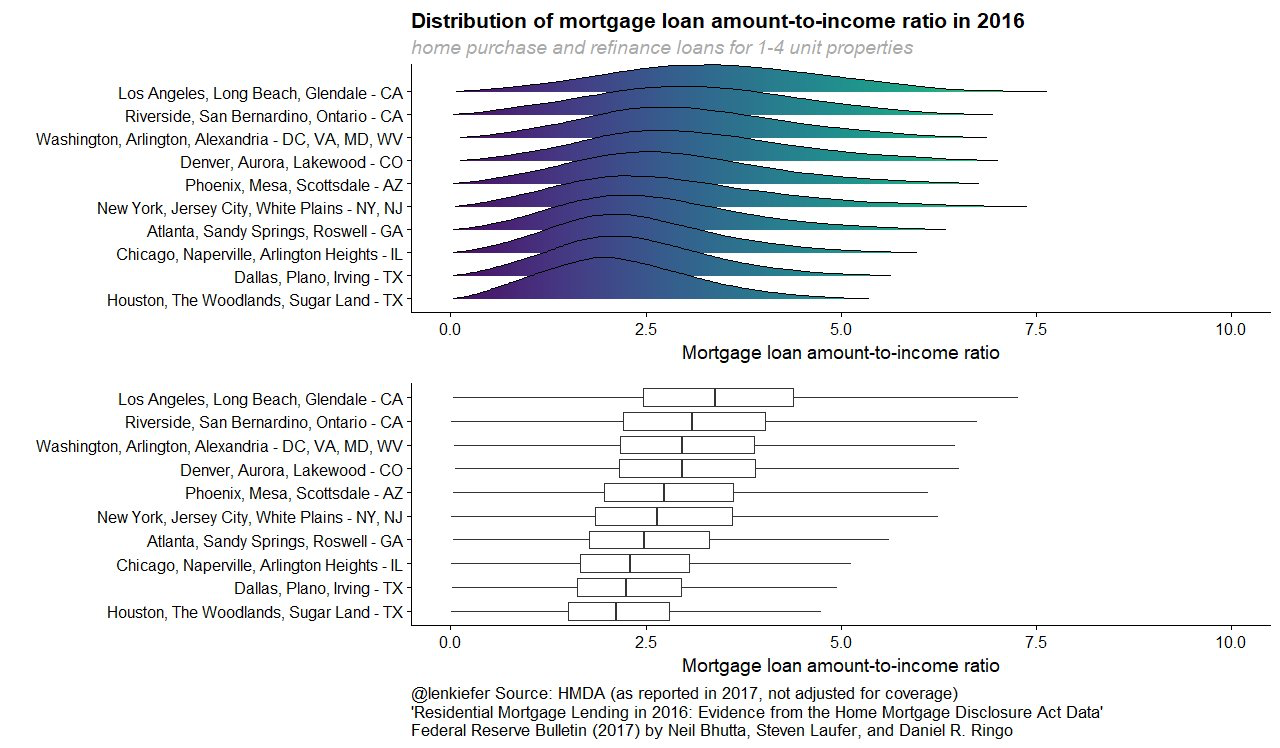
Ridgelines show modes and movement better.
But generally, ridgelines won't provide more insight than other graphs. It even loses information since it is a smooth approximation of the data and doesn't provide exact statistics like Boxplot.
ggridges is an implementation for ridgelines.
 by zcysxy