Missing Data
This note is about visualizing the missing data and its patterns, but not analyzing or complementing the missing data.
Row/Column Missing Patterns
- Do all rows/columns have the same percentage of missing values?
- Usually, in practice, different rows/columns have different percentages of missing values
- Are there correlations between missing rows/columns?
- Strong correlation: if a value is missing in one column it is likely to be missing in another column
Visualization
Heatmaps are suitable for visualizing missing data.
First, use tidyr to convert column names into one variable. Then plot a Heatmap with the x-axis being column names (variable name), the y-axis being row names (observation id), and the color indicating missing values.
An example:
library(tidyverse)
set.seed(5702)
mycars <- mtcars
mycars[,"gear"] <- NA
mycars[10:20, 3:5] <- NA
for (i in 1:10) mycars[sample(32,1), sample(11,1)] <- NA

tidycars <- mycars %>%
    rownames_to_column("id") %>%
    gather(key, value, -id) %>%
    mutate(missing = ifelse(is.na(value), "yes", "no"))

ggplot(tidycars, aes(x = key, y = fct_rev(id), fill = missing)) +
  geom_tile(color = "white") +
  ggtitle("mtcars with NAs added") +
  ylab('') +
  scale_fill_viridis_d() + # discrete scale
  theme_bw()
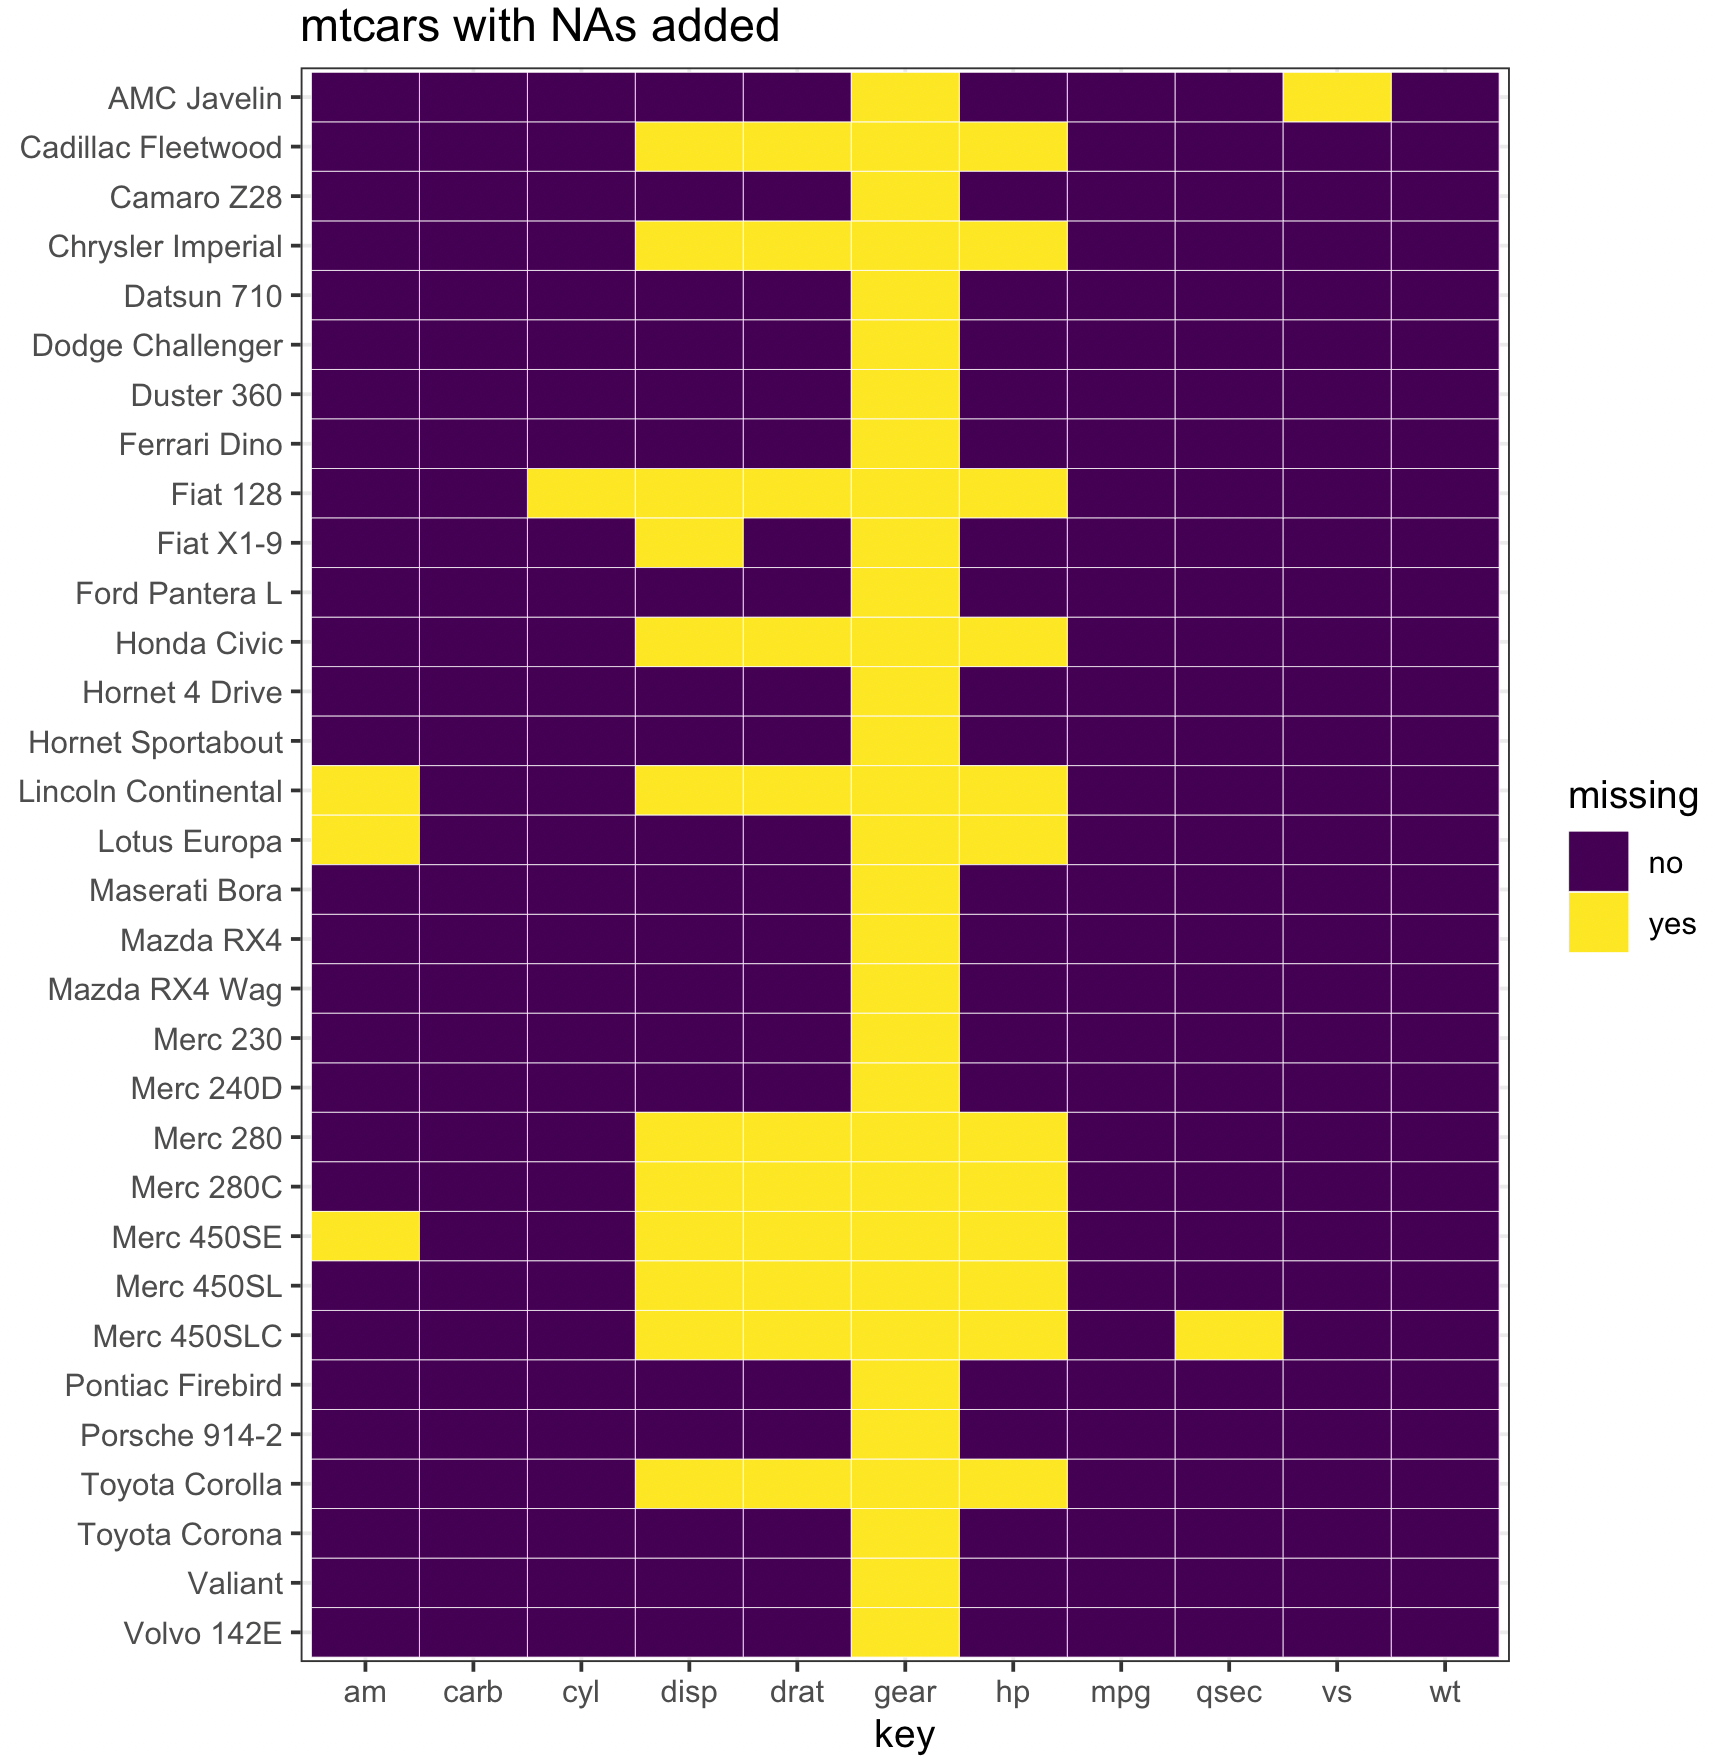
A better idea is to combine the normal Heatmap with missing data: use one color to present missing data, and a sequential color palette to present the magnitude of other values.
- To better explore the patterns (the combination of columns missing), we can sort column names by the number of missing.
plot_missing()
Function plot_missing() from R Package redav is a powerful tool to explore missing patterns. It renders graphs like this
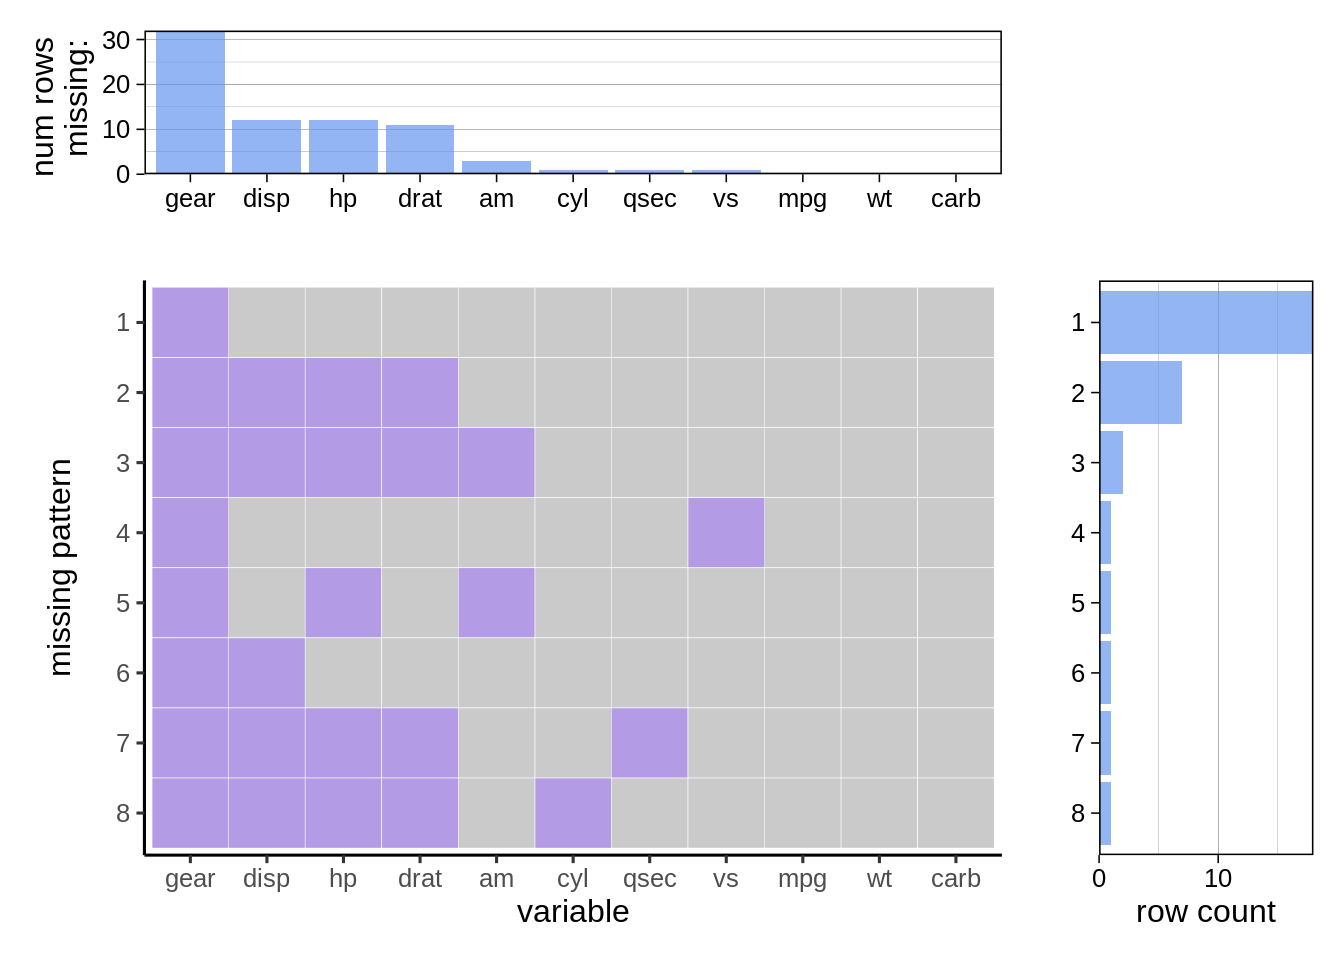
- The top part shows the number of missing values in each column
- The middle part presents the missing patterns
- repeated missing patterns are reduced to one row
- The right part shows the counts for each missing pattern
(consecutive missing values) - You can also show the percentage in the top/right graphs by setting
percentage = True.
Value Missing Patterns
- Are missing patterns correlated with values of another variable?
- Are certain value ranges more likely to be missing?
A pattern according to package mi is a subset of variables. So there are total
library(mi)
x <- mi::missing_data.frame(mycars)
summary(x@patterns)
 by zcysxy