EDAV - Multivariate Categorical Data
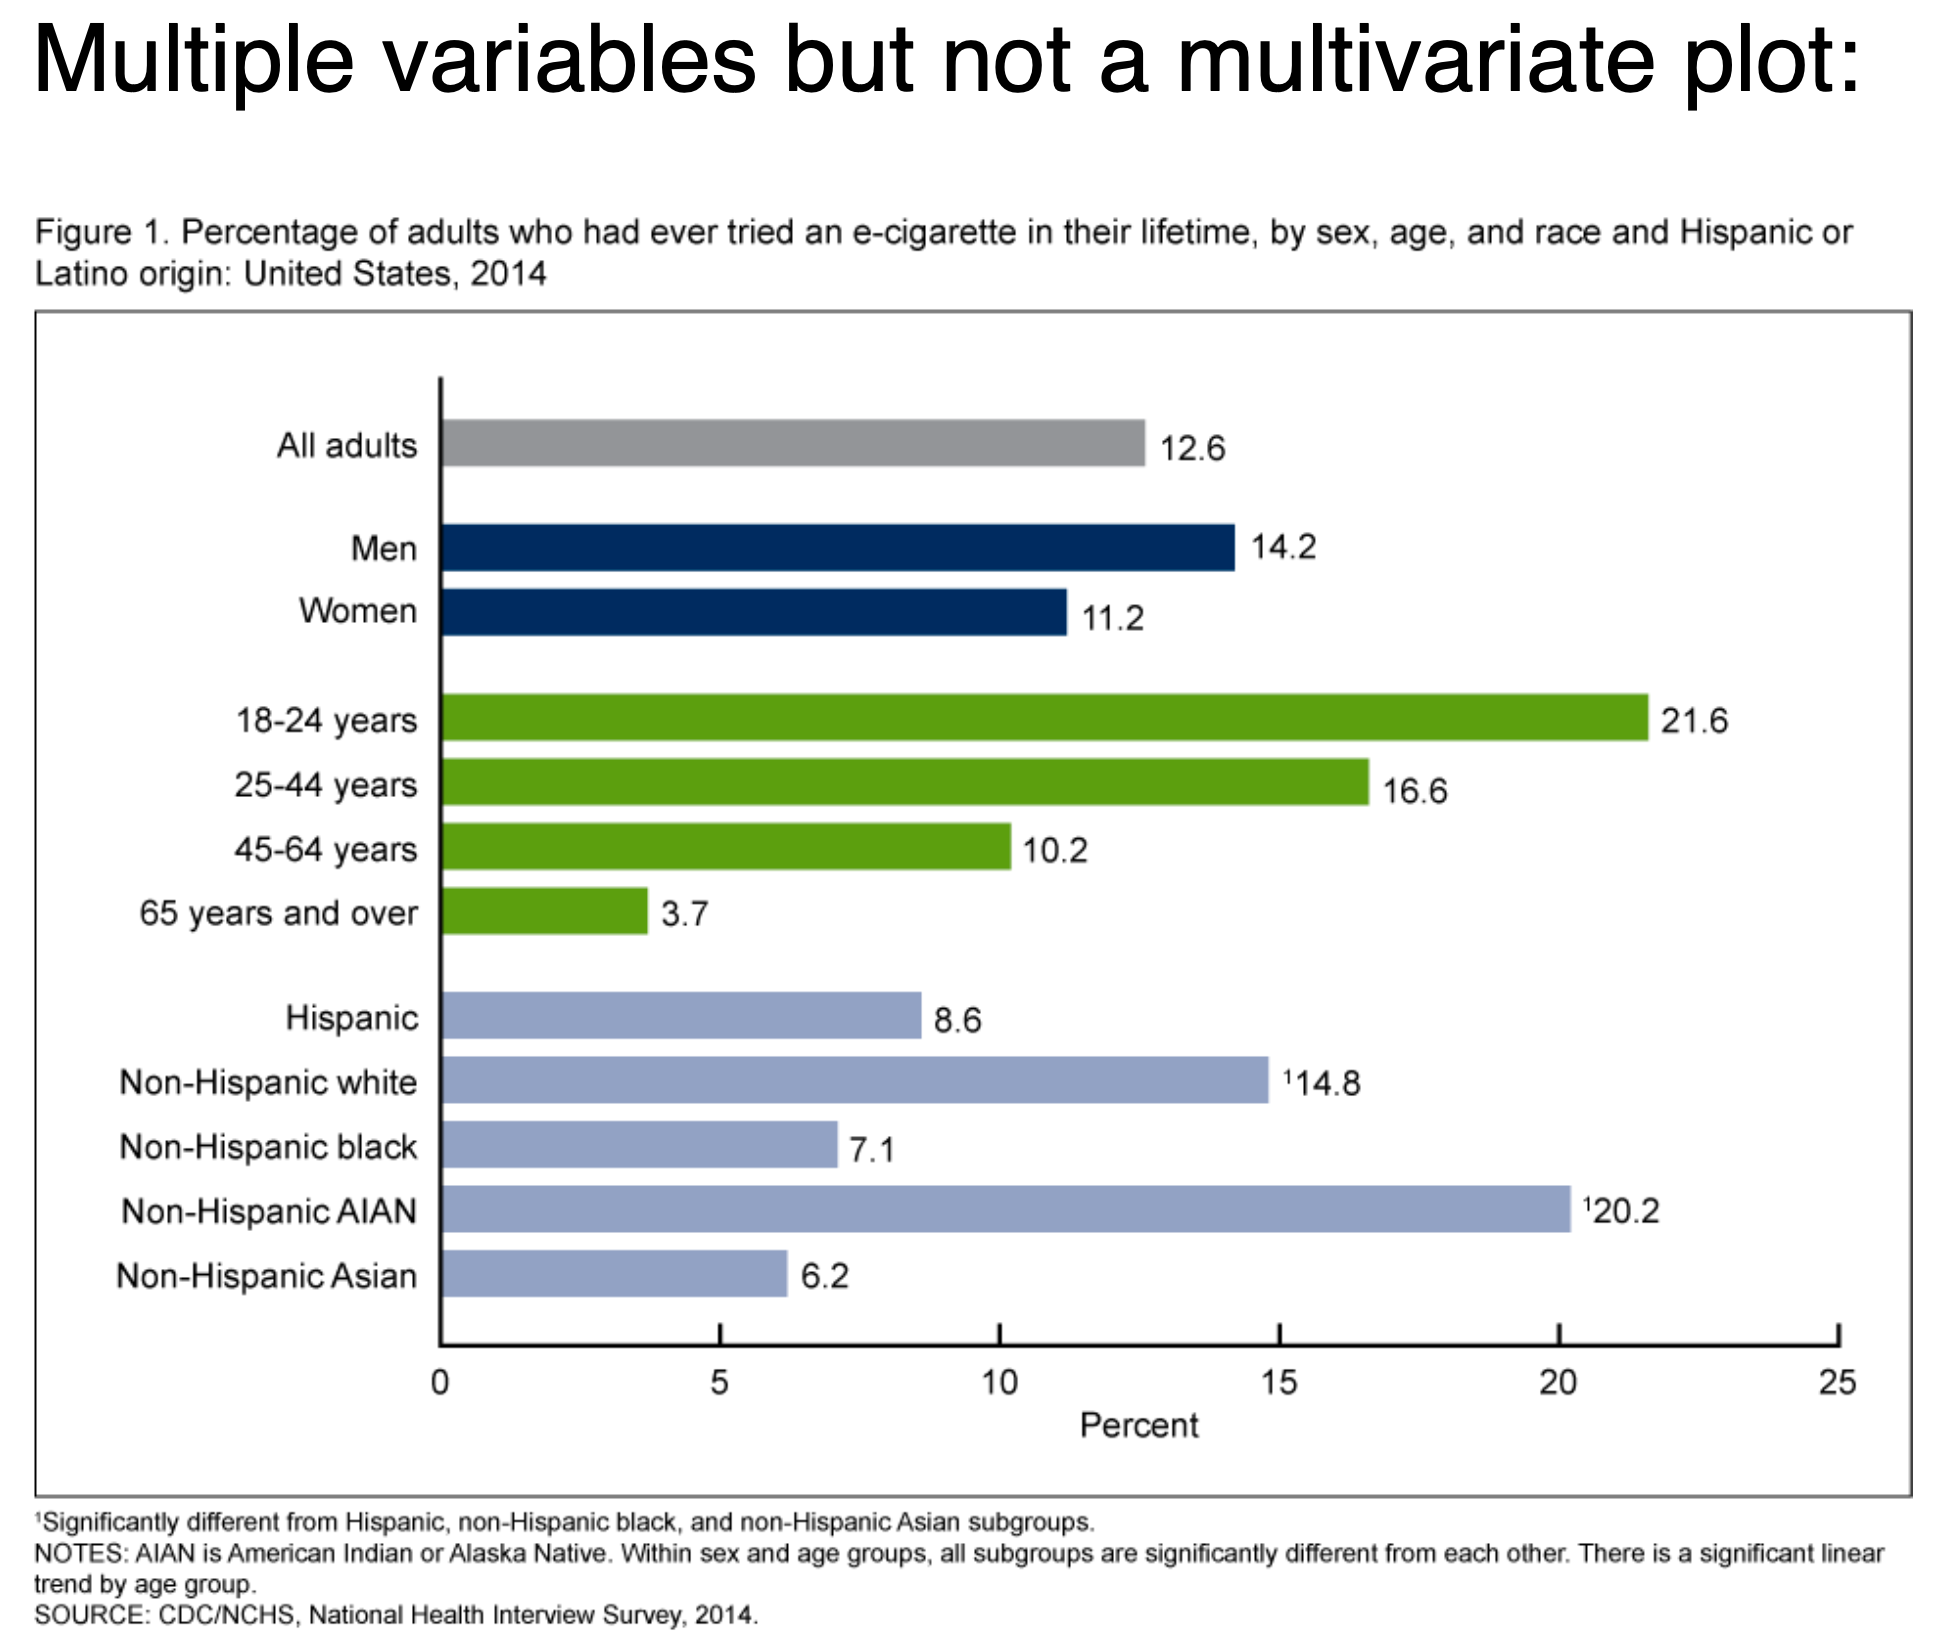
When creating a graph for multivariate categorical data, we don't want multiple graphs for each categorical variable. Instead, we want to see the magnitude of phenomena (counts, frequency, etc.) in the multivariate combinations of categorical variables.

Graphs
To highlight different aspects of data in different categories, we can use
- Frequency
- Bar Chart
- Stacked bars
- Grouped bars
- Cleveland Dot Plot
- multiple dots
- facets
- Bar Chart
- Proportion / Association
- Change of State
 by zcysxy